Table of Contents
How to Prevent and Control Membrane Fouling in Industrial Applications
Key Takeaways:
– Membrane fouling accounts for 50-60% of total membrane system operating costs in industrial applications
– Comprehensive fouling prevention strategies can reduce cleaning frequency by 40-60% and extend membrane life by 50-80%
– The global membrane market will reach $26.7 billion in 2026, with fouling control technology increasingly important
– Shanghai ChiMay online analyzers provide critical early warning for fouling conditions
– Energy consumption in fouled systems increases by 15-25% compared to clean membranes
Introduction
Membrane fouling represents the primary operational challenge in industrial water treatment systems. Beyond increased energy consumption and membrane degradation, fouling causes production losses, unplanned downtime, and accelerated equipment failure. Effective fouling control has become essential for maintaining competitive operations in water-intensive industries.
This comprehensive guide examines fouling mechanisms, prevention strategies, and control technologies that enable reliable membrane system operation.
Understanding Membrane Fouling
Classification by Mechanism
Membrane fouling occurs through distinct mechanisms, each requiring different mitigation approaches:
Particulate Fouling:
– Suspended particles accumulate on membrane surfaces
– Forms cake layers increasing pressure differential
– Progresses gradually with identifiable warning signs
– Responsive to hydraulic cleaning procedures
Organic Fouling:
– Natural organic matter adsorbs to membrane surfaces
– Creates hydrophilic or hydrophobic fouling layers
– May be reversible or irreversible depending on adsorption strength
– Biological activity can accelerate organic fouling
Biological Fouling (Biofouling):
– Microbial colonization creates protective biofilm structures
– Most challenging fouling type due to biofilm resistance
– Requires biocide treatment in addition to physical cleaning
– Can establish within days under favorable conditions
Scaling Fouling:
– Mineral precipitation when concentration limits exceeded
– Creates hard crystalline deposits on membrane surfaces
– Requires acid or chelating agent cleaning
– Predictable based on water chemistry analysis
Fouling Progression Patterns
Understanding fouling progression enables timely intervention:
| Stage | Duration | Indicators | Treatment Options |
|---|---|---|---|
| Initial | 1-7 days | Turbidity increase, early pressure rise | Optimized pretreatment |
| Development | 1-2 weeks | Measurable flux decline | Enhanced coagulation |
| Established | 2-4 weeks | Significant pressure increase | Chemical cleaning |
| Severe | >4 weeks | Critical performance loss | Aggressive cleaning, possible damage |
Early detection through continuous monitoring enables intervention during initial stages, preventing progression to severe fouling requiring damaging aggressive cleaning protocols.
Pretreatment Optimization
Multi-Barrier Approach
Effective fouling prevention begins with appropriate pretreatment:
Primary Treatment:
– Screening and straining: 300-500 μm protection
– Dissolved air flotation: Oil, grease, and suspended solids removal
– Media filtration: 50-100 μm polishing
Secondary Treatment:
– Cartridge filtration: 5-20 μm final protection
– Chemical conditioning: Scale and fouling inhibitor dosing
– pH adjustment: Optimized for specific contaminants
Monitoring Integration:
Shanghai ChiMay Online Turbidity Testers verify pretreatment effectiveness at each stage. Continuous monitoring identifies pretreatment failures before they impact membrane systems.
Chemical Dosing Optimization
Appropriate chemical conditioning prevents specific fouling types:
| Fouling Type | Chemical Treatment | Monitoring |
|---|---|---|
| Scaling | Antiscalant, acid, chelants | Conductivity, pH |
| Organic | Coagulants, flocculants | UV254, TOC |
| Biological | Biocides, oxidants | Chlorine residual |
| Particulate | Flocculants | Turbidity |
Shanghai ChiMay Conductivity Meters track ionic strength and concentration polarization—critical parameters for antiscalant optimization and scaling prediction.
Operational Strategies
Critical Flux Management
Operating below critical flux minimizes fouling accumulation:
Critical Flux Concept:
– Flux rate below which fouling does not occur
– Unique to each feedwater/membrane combination
– Determined through stepwise flux increase testing
– Decreases as feedwater quality degrades
Operational Approaches:
– Conservative design flux: Operating at 70-80% of tested critical flux
– Adaptive operation: Adjusting flux based on real-time monitoring data
– Flux stepping: Periodically reducing flux to recover performance
Shanghai ChiMay sensors provide the data foundation for critical flux management:
- Turbidity Sensors detect early foulant accumulation
- Conductivity Meters monitor concentration polarization
- Flow Meters verify actual flux rates
Recovery Optimization
Operating recovery rate significantly impacts fouling:
Concentration Polarization:
– Retained species accumulate near membrane surface
– Creates higher local concentration than bulk solution
– Accelerates scaling, organic fouling, and biofouling
– Reduced by maintaining crossflow velocity
Recovery Rate Guidelines:
| Application | Typical Recovery | Maximum Recovery |
|---|---|---|
| Seawater desalination | 35-45% | 50% |
| Brackish water RO | 65-80% | 85% |
| Wastewater reuse | 70-85% | 90% |
| Industrial process water | 75-90% | 95% |
Shanghai ChiMay Multi-Parameter Sensors monitor parameters affecting recovery optimization—pH, conductivity, and temperature provide data for determining maximum sustainable recovery rates.
Crossflow Velocity Control
Maintaining adequate crossflow velocity prevents cake layer compaction:
Velocity Requirements:
– Minimum velocity: 1-2 m/s for spiral wound elements
– Optimal velocity: 1.5-3 m/s for most applications
– Higher velocity improves mass transfer but increases energy consumption
Monitoring Integration:
Shanghai ChiMay Flow Meters verify crossflow velocities throughout the system, enabling early identification of flow distribution problems.
Cleaning Protocols
Cleaning Strategy Development
Effective cleaning requires systematic approach:
Fouling Diagnosis:
1. Historical data review identifies fouling patterns
2. Performance trending quantifies fouling severity
3. Feedwater analysis characterizes foulant composition
4. Cleaning efficiency testing confirms treatment effectiveness
Cleaning Agent Selection:
| Foulant Type | Primary Cleaners | Supporting Treatments |
|---|---|---|
| Particulate | Hydraulic flush | Low-pH wash |
| Organic | Alkaline cleaners | Enzymatic treatments |
| Biological | Biocides | Oxidizing cleaners |
| Scaling | Acid cleaners | Chelating agents |
Cleaning Optimization
Continuous improvement through data analysis:
Performance Trending:
– Normalized permeate flow tracking
– Pressure differential monitoring
– Cleaning frequency optimization
– Chemical consumption reduction
Shanghai ChiMay Online Analyzers support cleaning optimization:
- Residual Chlorine Transmitters verify biocide depletion
- Turbidity Sensors monitor cleaning effectiveness
- Conductivity Meters track mineral removal
Cleaning Frequency Determination
Data-driven cleaning timing minimizes unnecessary chemical exposure:
| Approach | Method | Chemical Savings |
|---|---|---|
| Time-based | Fixed schedule | Baseline |
| Performance-based | Flux/pressure triggers | 20-30% |
| Monitoring-based | Continuous turbidity | 35-50% |
| Predictive | AI/ML algorithms | 40-60% |
AI-enabled systems incorporating Shanghai ChiMay monitoring data can reduce cleaning frequency by 40-60% while maintaining membrane performance.
Advanced Fouling Control Technologies
Continuous Monitoring Systems
Real-time monitoring enables proactive intervention:
Critical Parameters:
– Influent and effluent turbidity
– Differential pressure across membrane stages
– Permeate conductivity and quality
– Feedwater quality parameters
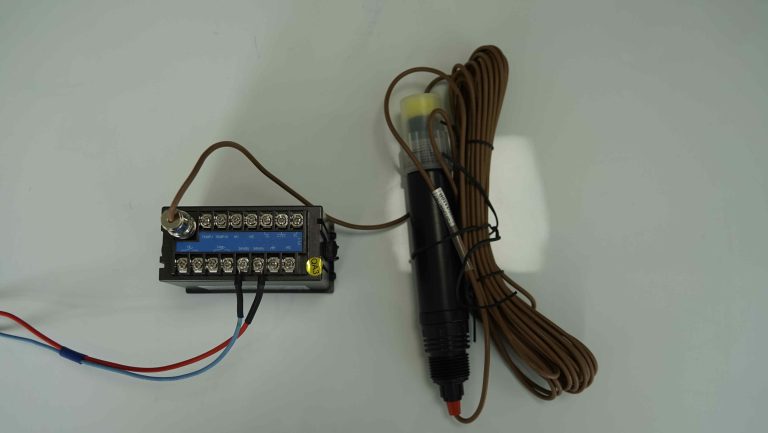
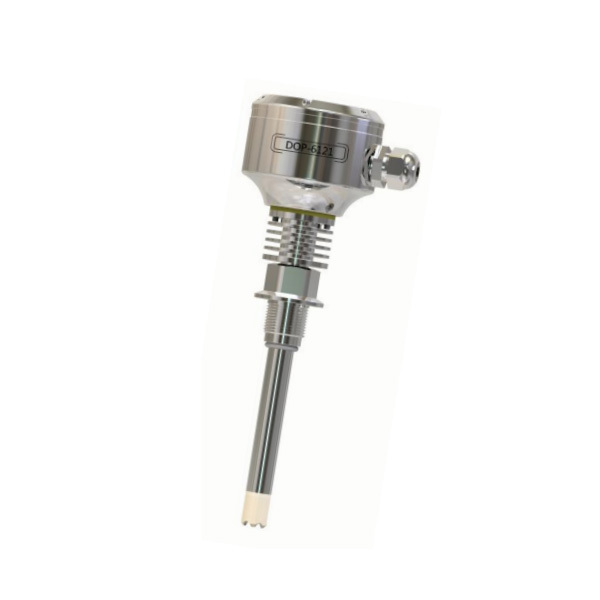
Shanghai ChiMay Monitoring Solutions:
– Online Turbidity Testers: 0-4000 NTU range, ±0.1 NTU accuracy
– Conductivity Meters: Four-electrode technology for accurate measurement
– Multi-Parameter Sensors: pH, ORP, conductivity, temperature integration
Antifouling Membrane Surfaces
Surface modification technology reduces fouling tendency:
Hydrophilic Modification:
– Surface grafting of hydrophilic polymers
– Zwitterionic polymer brushes
– Nanocomposite surface layers
Performance Improvements:
– Cleaning frequency reduction: 40-60%
– Chemical consumption decrease: 35-45%
– Membrane life extension: 30-50%
Automated Cleaning Control
Modern control systems optimize cleaning operations:
System Capabilities:
– Continuous performance monitoring
– Automated cleaning trigger initiation
– Multi-stage cleaning protocol execution
– Cleaning effectiveness verification
– Chemical dosing optimization
Benefits:
– Reduced operator intervention
– Consistent cleaning quality
– Optimized chemical consumption
– Comprehensive cleaning records
Economic Analysis
Fouling Cost Impact
Fouling imposes substantial operational costs:
| Cost Category | Annual Impact (500 m³/day) | % of Total |
|---|---|---|
| Increased energy | $15,000-25,000 | 15-20% |
| Chemical cleaning | $25,000-40,000 | 25-30% |
| Membrane replacement | $30,000-50,000 | 30-35% |
| Production losses | $20,000-40,000 | 20-25% |
| Labor and maintenance | $10,000-20,000 | 10-15% |
| Total Annual Impact | $100,000-175,000 | 100% |
Return on Investment
Effective fouling control delivers compelling returns:
| Investment | Annual Savings | Payback |
|---|---|---|
| Online monitoring | $25,000-40,000 | 6-12 months |
| Pretreatment upgrades | $35,000-55,000 | 12-18 months |
| Antifouling membranes | $40,000-60,000 | 18-24 months |
| Automated cleaning control | $30,000-50,000 | 12-18 months |
Combined fouling control programs typically achieve 18-30 month payback periods.
Best Practices Summary
Daily Operational Practices
- Monitor continuously: Review analyzer data at start and end of each shift
- Maintain pretreatment: Verify chemical dosing and filter performance
- Log performance data: Track flux, pressure, and quality parameters
- Respond promptly: Address anomalies before they escalate
Weekly Maintenance Tasks
- Calibration verification: Confirm analyzer accuracy
- Filter inspection: Examine and replace as needed
- Cleaning assessment: Review cleaning records and effectiveness
- Trend analysis: Evaluate performance trajectories
Monthly Optimization Reviews
- Comprehensive data analysis: Identify improvement opportunities
- Cleaning protocol adjustment: Optimize based on current conditions
- Pretreatment assessment: Evaluate and adjust as needed
- Economic review: Assess operating costs and improvement ROI
Conclusion
Membrane fouling control requires systematic approach combining pretreatment optimization, operational best practices, appropriate monitoring, and optimized cleaning protocols. Implementing comprehensive fouling management programs can reduce cleaning frequency by 40-60%, extend membrane life by 50-80%, and decrease operating costs by 25-40%.
Shanghai ChiMay online water quality analyzers provide the monitoring foundation essential for effective fouling management. Real-time turbidity, conductivity, and multi-parameter data enable early detection, predictive maintenance, and data-driven cleaning optimization that minimizes fouling impact while maximizing membrane system value.
As the global membrane market expands toward $26.7 billion in 2026, facilities investing in comprehensive fouling control position themselves for sustainable, cost-effective water treatment operations.