Table of Contents
Key Takeaways
- Regular maintenance extends water quality sensor life by 2-3 times compared to neglected sensors
- Preventive maintenance programs reduce 70% of unplanned sensor failures and associated downtime
- Proper cleaning and calibration techniques maintain measurement accuracy within ±2% of original specifications
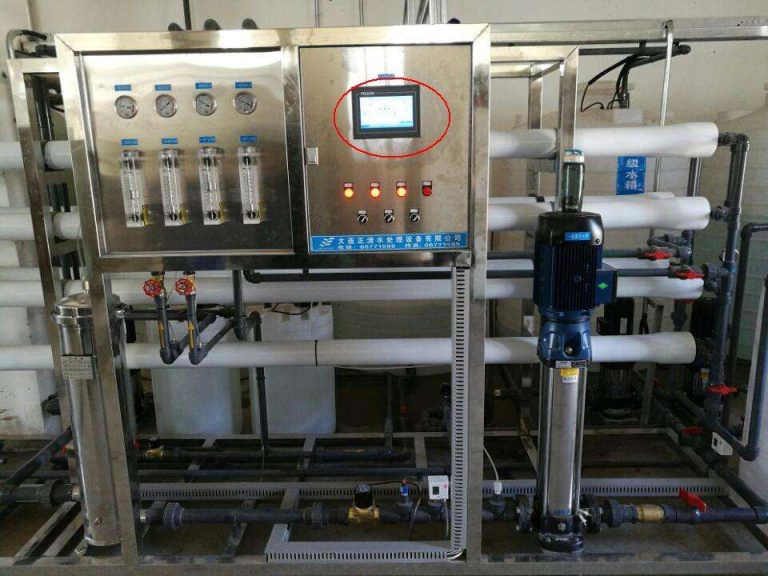
Water quality sensors represent significant investments in industrial monitoring infrastructure. Proper maintenance protects this investment while ensuring the accurate, reliable data that drives process optimization and regulatory compliance.
Understanding Sensor Degradation Mechanisms
Water quality sensors operate in challenging environments that cause gradual performance decline. Understanding these degradation mechanisms helps operators implement appropriate maintenance strategies.
Electrochemical Sensor Aging
pH electrodes degrade through several mechanisms:
- Glass membrane hydration: Surface glass slowly dissolves, changing response characteristics
- Reference junction fouling: Pore blockage reduces reference stability
- Junction potential drift: Accumulated junction potentials cause measurement offset
- Coating accumulation: Organic and inorganic deposits insulate measurement surfaces
Industry studies indicate that electrochemical sensors without maintenance lose approximately 0.01-0.02 pH units per month in typical industrial applications.
Optical Sensor Contamination
Optical sensors (turbidity, dissolved oxygen) suffer from:
- Window fouling: Biofilm and particles reduce light transmission
- Coating formation: Mineral deposits on optical surfaces
- LED degradation: Light source intensity decreases over time
- Photodetector drift: Detector sensitivity changes with temperature and age
Conductivity Cell Fouling
Conductivity sensors face unique challenges:
- Polarization effects: Electrode surfaces accumulate charge carriers
- Scale formation: Mineral deposits alter cell constant
- Biological growth: Biofilm creates insulating layers
- Electrode corrosion: Surface changes affect measurement characteristics
Preventive Maintenance Program Design
Effective maintenance programs balance maintenance effort against the benefits of improved sensor performance. The optimal program considers:
- Sensor criticality: More critical sensors warrant more frequent attention
- Application severity: Harsh conditions require shorter maintenance intervals
- Historical performance: Calibration records guide interval adjustment
- Resource availability: Practical programs must fit maintenance capacity
Maintenance Task Categories
Daily Tasks (5-10 minutes)
- Visual inspection for obvious problems
- Verify normal readings on display/control system
- Check for alarm conditions
- Confirm data logging is functioning
Weekly Tasks (30-45 minutes)
- Clean sensor housing exterior
- Inspect cables and connections
- Verify calibration is within specifications
- Review trend data for anomalies
Monthly Tasks (1-2 hours)
- Perform sensor cleaning per manufacturer guidelines
- Verify calibration with reference standards
- Inspect and clean flow cells or installation hardware
- Document all maintenance activities
Quarterly/Semi-annual Tasks (2-4 hours)
- Complete two-point calibration
- Replace expendable components (membranes, electrolyte)
- Verify communication with control systems
- Review maintenance history and adjust intervals
Sensor-Specific Maintenance Procedures
ph sensor Maintenance
Daily Inspection
- Verify sensor displays stable reading
- Check for visible coating or deposits
- Confirm reference junction is moist
Weekly Cleaning
- Rinse sensor with clean water
- Remove loose deposits with soft brush
- Soak in mild acid solution (0.1M HCl) for 15 minutes if scaling present
- Rinse thoroughly with clean water
- Verify calibration after cleaning
Calibration Procedure
- Allow sensor to stabilize in first buffer (typically pH 7.0) for 5 minutes
- Adjust reading to match buffer value at measurement temperature
- Rinse sensor with second buffer (typically pH 4.0 or 10.0)
- Allow stabilization and verify reading within ±0.05 pH
- If out of tolerance, repeat cleaning and calibration
Electrode Replacement
- Replace electrodes every 12-24 months depending on application
- Replace immediately if glass cracks or reference dries out
- ChiMay offers electrode exchange programs for convenient replacement
Conductivity Sensor Maintenance
Cleaning Procedures
- Remove sensor from process
- Soak in descaling solution if mineral deposits present
- Clean electrodes with soft brush or ultrasonic bath
- Rinse thoroughly with deionized water
- Reinstall and verify calibration
Calibration Verification
- Use certified conductivity standards (typically 100 µS/cm and 1,000 µS/cm)
- Compare reading to standard value
- If deviation exceeds ±2%, clean and recalibrate
- Record calibration data for compliance documentation
turbidity sensor Maintenance
Window Cleaning
- Remove sensor from installation
- Inspect optical windows for deposits
- Clean with manufacturer-recommended solution
- Polish windows with soft, lint-free cloth
- Rinse with clean water and reinstall
Calibration
- Use primary calibration standards (formazin or AMCO-AEPA)
- Verify reading at low range (<1 NTU) and mid-range (20-100 NTU)
- Maintain calibration records per regulatory requirements
dissolved oxygen sensor Maintenance
Membrane Inspection
- Check membrane for tears, punctures, or deformation
- Verify membrane is secure and properly tensioned
- Replace membrane if any damage is visible
Electrolyte Replacement
- Remove sensor from installation
- Unscrew membrane cap
- Discard old electrolyte
- Clean membrane and cap with deionized water
- Fill with fresh electrolyte, avoiding bubbles
- Reassemble and reinstall
Calibration
- Allow sensor to equilibrate in air-saturated water
- Verify reading matches dissolved oxygen saturation value
- Adjust calibration if needed (typically <5% adjustment)
- Record calibration data
Troubleshooting Common Problems
Unstable Readings
Possible Causes:
- Air bubbles in flow cell
- Ground loop interference
- Loose electrical connection
- Coating on sensor surfaces
- Reference junction depletion
Resolution Steps:
- Check for and eliminate air bubbles
- Verify proper grounding
- Inspect and secure all connections
- Clean sensor per maintenance procedures
- Replace reference if problem persists
Slow Response
Possible Causes:
- Heavy coating accumulation
- Membrane fouling or damage
- Temperature not stabilized
- Sensor aging
Resolution Steps:
- Perform thorough cleaning
- Replace membrane if applicable
- Allow adequate stabilization time
- Replace sensor if response remains sluggish
Calibration Will Not Hold
Possible Causes:
- Damaged electrode/sensor
- Incorrect calibration standards
- Reference contamination
- Electronics failure
Resolution Steps:
- Verify calibration standard accuracy
- Replace electrode/sensor
- Check reference junction condition
- Test transmitter electronics
- Replace faulty components
Maintenance Documentation
Complete documentation supports regulatory compliance and enables continuous improvement:
Required Records:
- Date and time of all maintenance activities
- Personnel performing maintenance
- Specific procedures followed
- Calibration standard information
- Before and after readings
- Any corrective actions taken
- Parts or materials used
Record Retention:
- Maintain calibration records for minimum 3 years (or regulatory requirement)
- Keep maintenance logs for equipment lifetime plus 1 year
- Document sensor replacement with serial numbers
Cost-Benefit Analysis
Investment in maintenance programs delivers measurable returns:
| Maintenance Investment | Typical Savings |
|---|---|
| Labor for preventive maintenance | 50% reduction in corrective maintenance |
| Calibration standards | Extended sensor life reduces replacement costs |
| Cleaning supplies | Improved accuracy reduces process losses |
| Documentation time | Compliance audit preparation time reduced |
Facilities with structured maintenance programs typically achieve:
- 40-60% reduction in sensor replacement costs
- 80% reduction in unplanned downtime related to sensors
- 25% improvement in overall data quality
Conclusion
Water quality sensor maintenance protects monitoring investments while ensuring accurate, reliable data for process control and compliance. By implementing structured preventive maintenance programs tailored to their specific applications, facilities can extend sensor life, reduce operating costs, and improve overall monitoring effectiveness.
ChiMay provides comprehensive maintenance support including technical documentation, calibration services, and replacement parts to help customers maximize sensor performance throughout the equipment lifecycle.