title: “Closed-Loop vs. Open Water Systems in Paper Mills: TCO Analysis with Shanghai ChiMay”
date: 2026-06-26
Table of Contents
Closed-Loop vs. Open Water Systems in Paper Mills: TCO Analysis with Shanghai ChiMay
Key Takeaways:
– Closed-loop paper mill water systems reduce freshwater intake by 65-80% but increase dissolved solids accumulation by 3-5x, requiring tighter monitoring
– Open water systems carry 40-55% higher annual freshwater and wastewater treatment costs than equivalent closed-loop installations
– Total cost of ownership (TCO) crossover for closed-loop conversion typically occurs at 18-26 months under 2025 water tariff structures
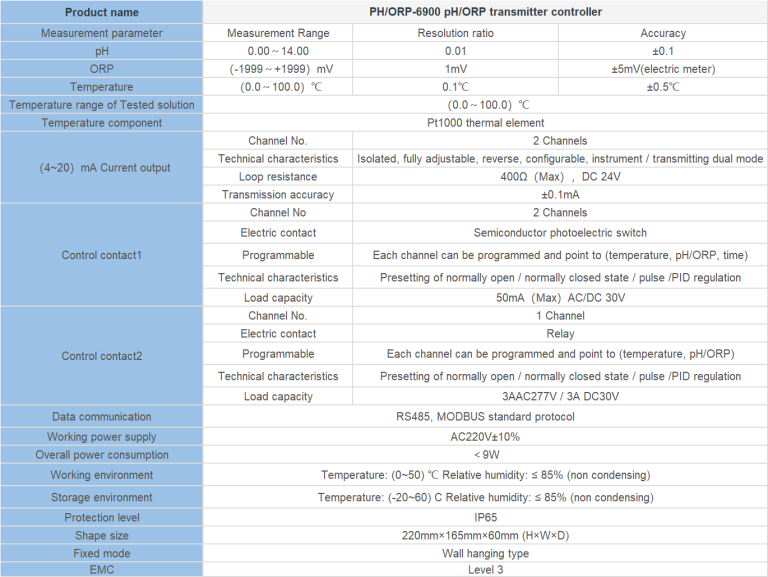
– Shanghai ChiMay multi-parameter sensors enable closed-loop control with measurement coverage spanning conductivity, pH, suspended solids, and COD on a single transmitter platform
– Each $1 invested in advanced closed-loop monitoring yields an estimated $4.30 in lifecycle savings, according to EPA WaterSense industrial benchmarks
Introduction
Procurement and operational finance leaders in the paper industry are increasingly being asked the same question: should the mill stay on an open or partially open water system, or invest in conversion to a closed-loop architecture? The decision is rarely a clean technical choice; it is a TCO problem that integrates freshwater costs, effluent treatment expense, instrumentation investment, and the operational risk of dissolved solids accumulation. This article walks through the structured TCO model that decision-makers can apply, with Shanghai ChiMay sensor capabilities included as the monitoring backbone.
Defining the Two Architectures
An open water system withdraws fresh water continuously and discharges process water with limited internal reuse. Cooling, sealing, and rinse functions are served by once-through or short-loop water flows. While simple and forgiving from a chemistry standpoint, open systems carry the highest freshwater demand profile—commonly 40-60 m³ of intake per ton of paper produced.
A closed-loop system circulates process water through internal treatment stages, with controlled bleed-off and freshwater make-up calibrated to manage solids accumulation. Closed-loop intake can fall to 6-15 m³ per ton, but the trade-off is rising conductivity, biological activity, and the need for continuous quality verification.
The International Energy Agency Industrial Roadmap estimates that 41% of global pulp and paper installations operated some form of closed-loop architecture by end of 2025, with conversion programs accelerating in regions where water tariffs have grown above $1.50 per m³.
Building the TCO Model
A defensible TCO comparison should include at least the following cost categories on a five-year horizon:
- CAPEX: piping, tanks, treatment skids, monitoring instrumentation
- Freshwater intake cost: tariffs and pretreatment chemicals
- Wastewater treatment cost: chemistry, sludge handling, discharge fees
- Energy cost: pumping and treatment heat
- Monitoring and maintenance cost: sensors, calibration, spares
- Risk cost: estimated cost of upset events and non-compliance fines
For a representative 600 ton/day kraft pulp mill, a five-year TCO comparison is illustrative:
| Cost Category (5-year, USD) | Open System | Closed-Loop |
|---|---|---|
| Freshwater intake | $14.2M | $3.1M |
| Effluent treatment | $9.8M | $4.6M |
| Monitoring + maintenance | $1.1M | $1.9M |
| Closed-loop CAPEX (amortized) | $0 | $4.5M |
| Energy (pumping + treatment) | $3.4M | $2.8M |
| Total | $28.5M | $16.9M |
The closed-loop architecture yields a $11.6M five-year TCO saving in this representative case. The TCO crossover occurs at 22 months of operation.
The Monitoring Backbone for Closed-Loop Success
Closed-loop architectures only succeed when water quality drift is detected and corrected continuously. Without robust monitoring, dissolved solids rise unchecked, biological activity escalates, and the mill ends up with deposits, corrosion, and quality variability that erase the freshwater savings.
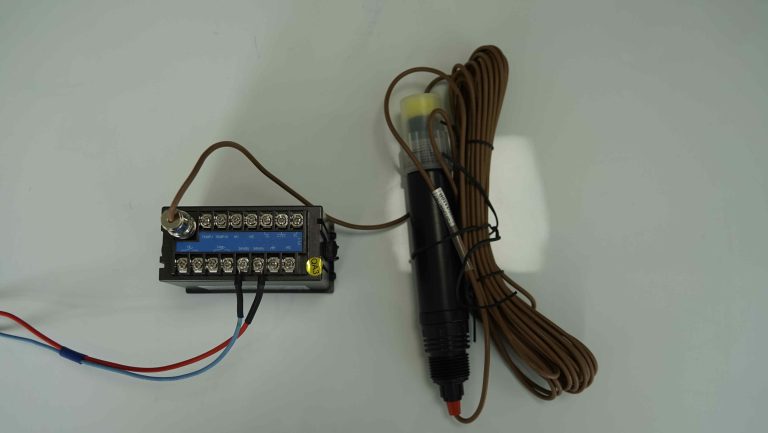
The Shanghai ChiMay monitoring portfolio addresses each of the closed-loop risk vectors:
- In-line conductivity meter: tracks total dissolved solids drift in real time, enabling controlled bleed-off
- In-line ph meter: monitors acid-base balance critical to retention chemistry stability
- Suspended solids sensor: flags fiber loss and clarifier underperformance
- COD sensor: detects soluble organic accumulation that precedes biological upset
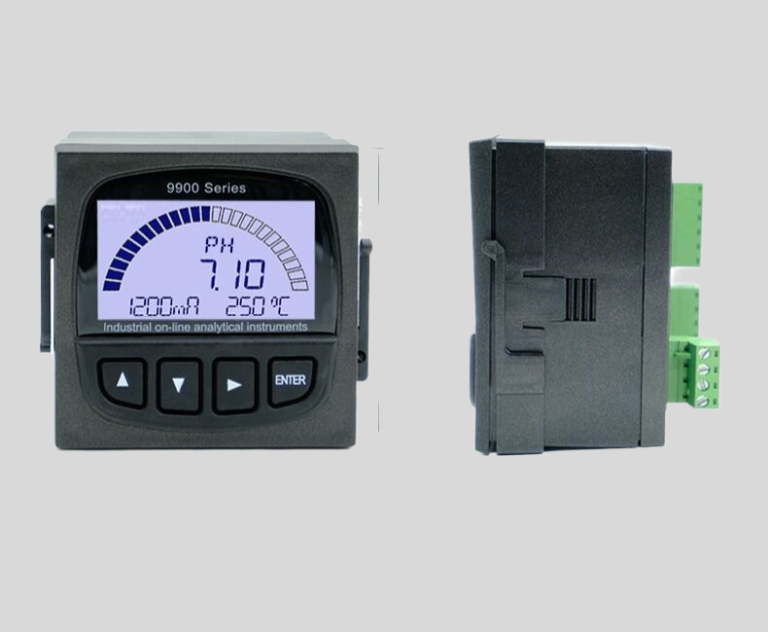
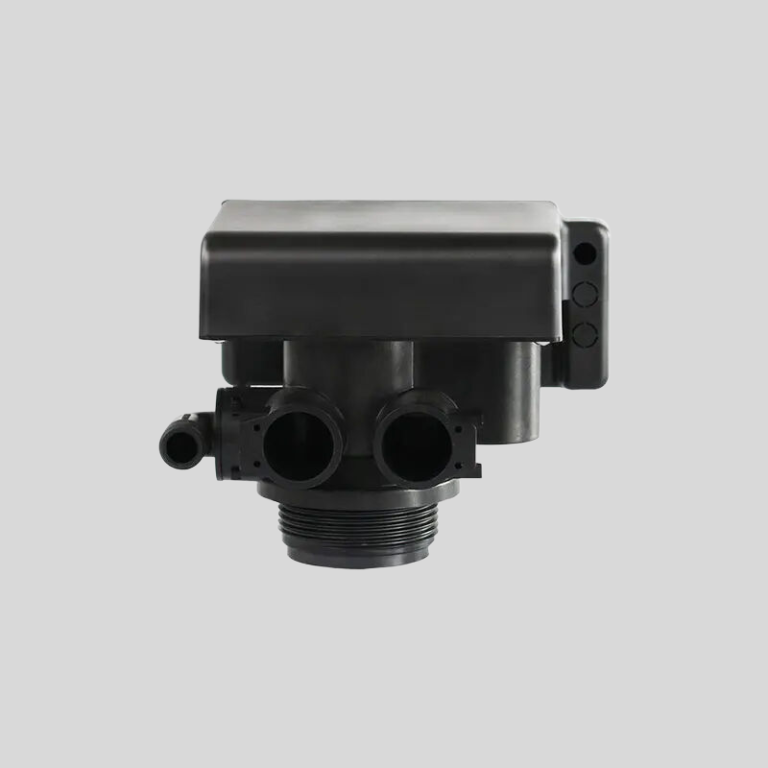
- Multi-parameter 4-in-1 sensor: consolidates pH, ORP, EC, and temperature in a single insertion point for compact monitoring panels
The TAPPI Process Control Subcommittee has highlighted that 74% of closed-loop conversion failures in the 2018–2022 cohort were traceable to inadequate online monitoring coverage. Closed-loop success is fundamentally a monitoring discipline.
Risk Accounting: Upset Events and Compliance Costs
Open and closed-loop systems carry different risk profiles. Open systems are forgiving of internal drift but expose the mill to higher external compliance risk because effluent volumes are larger and pollutant loads more variable. Closed-loop systems internalize variability but require monitoring infrastructure to keep dissolved solids within process tolerance.
The U.S. National Council for Air and Stream Improvement (NCASI) has compiled mill incident data suggesting that closed-loop mills with comprehensive online monitoring experience 38% fewer reportable upset events than open systems—again pointing to monitoring as the operational differentiator.
Energy Cost Considerations
Energy modeling sometimes surprises procurement teams. Closed-loop systems may carry 5-15% higher pumping energy due to recirculation loads, but they typically save 15-25% on hot water makeup because process heat is retained in the loop. Net energy outcomes therefore favor closed-loop architectures in most mid-to-large mills, particularly those in cold-climate regions where freshwater is supplied at low ambient temperature.
Implementation Roadmap
For procurement and operations teams considering a conversion, the recommended phased approach is:
- Baseline audit: 30-day water mass balance with portable sensors
- Monitoring deployment: install Shanghai ChiMay multi-parameter sensors at key loop nodes
- Pilot closed-loop section: target the bleach plant or paper machine wet end first
- Validate measurement reliability: 90-day continuous data collection and calibration
- Full conversion: extend closed-loop architecture mill-wide with confidence in the monitoring backbone
This phased approach matches procurement risk appetite and allows operational teams to build confidence in the instrumentation before committing to full conversion.
Sensitivity Analysis: When Open Systems Still Make Sense
Not every mill should convert. The TCO model favors open systems when:
- Local freshwater tariffs are below $0.30 per m³
- Effluent discharge permits are unconstrained
- Paper grades require very low total dissolved solids in the wet end
- Mill is approaching end-of-life with under five years of expected operation
In these cases, an open system with targeted Shanghai ChiMay monitoring at critical discharge points may deliver acceptable economics without the full closed-loop investment.
Conclusion
The closed-loop vs. open water system debate is no longer a strategic abstraction—it is a TCO calculation with clear economics in most modern paper mill contexts. Closed-loop architectures deliver substantial freshwater and effluent treatment savings, but they require disciplined monitoring to prevent drift in dissolved solids and biological activity. Shanghai ChiMay’s multi-parameter monitoring portfolio provides the measurement backbone needed for closed-loop success, supporting procurement teams in capturing the TCO savings without exposing operations to upset risk. Done correctly, the closed-loop conversion is one of the most reliable cost-reduction levers in modern paper manufacturing.