title: “Water Circularity KPIs That Executives Should Report to Sustainability Officers: Shanghai ChiMay Briefing”
date: 2026-07-10
perspective: C-Level Decision Maker
theme: Zero Liquid Discharge & Industrial Water Circularity
Table of Contents
Water Circularity KPIs That Executives Should Report to Sustainability Officers: Shanghai ChiMay Briefing
Key Takeaways
- Water circularity has moved from a niche engineering topic to a first-class sustainability disclosure, with ISSB S2, CDP Water, and regional regulators asking executives to report it as rigorously as emissions.
- The five most commonly requested KPIs in 2026—water reuse ratio, net intake, freshwater intensity, discharge quality index, and internal water cost—each require a specific measurement stack to produce credible data.
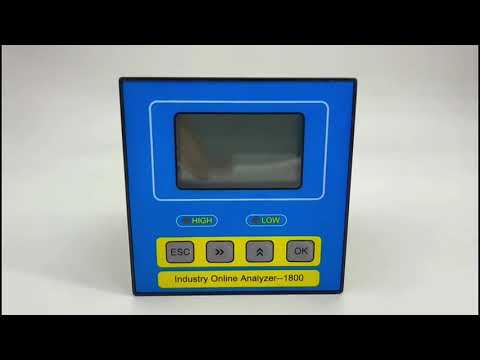
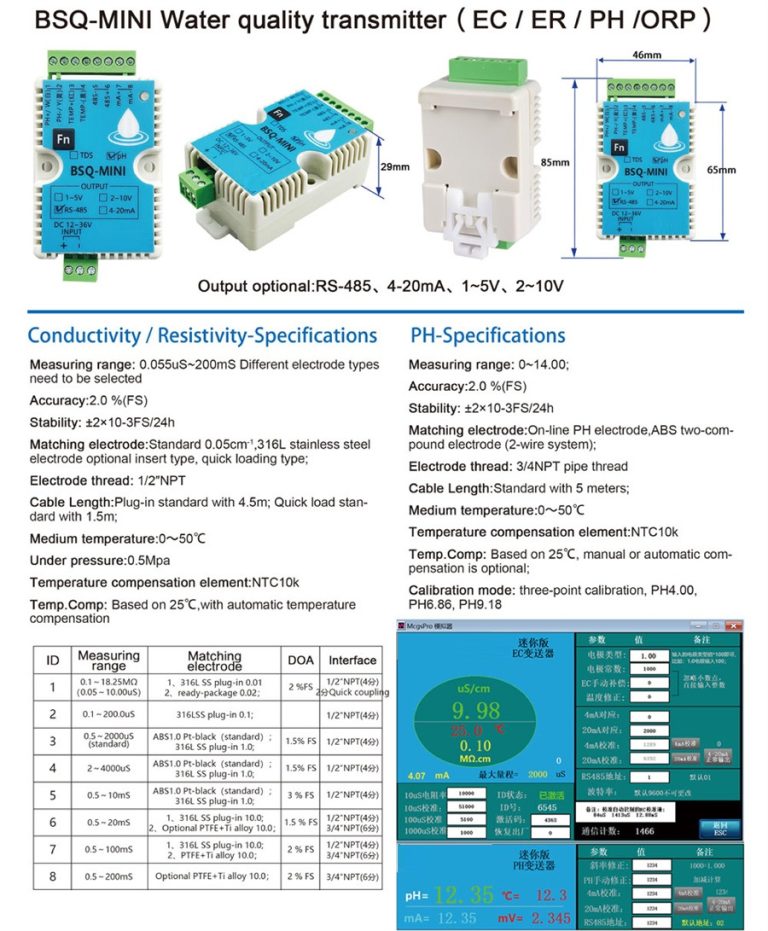
- Shanghai ChiMay’s multi-parameter sensors, conductivity meters, and suspended solids analyzers underpin these KPIs at the point of measurement, and their digital diagnostics help executives defend reported numbers under audit.
- The difference between “we track water” and “we report water circularity” is now measured in investor expectations and regulatory scrutiny.
Why Executives Need to Take Water Circularity Seriously
The sustainability conversation has shifted. Where water once sat in an engineering appendix to an annual report, it is now a named risk in investor briefings and a quantified disclosure under multiple frameworks. ISSB S2 treats water as part of the broader sustainability narrative. CDP Water surveys are answered by thousands of listed companies each year. India, China, the EU, and California all expect measurable commitments to circularity, and auditors are increasingly skeptical of estimates.
For executives, that means water circularity is no longer an optional engineering metric. It is a reported figure with consequences for valuation, access to capital, and social license to operate.
Five KPIs Executives Should Know
Water Reuse Ratio
The fraction of total water used on site that is recovered and put back into the process. A well-run ZLD plant can push this above 95%. A plant that relies on once-through cooling is likely below 30%. Measurement requires accurate flow on both freshwater intake and recovered loops.
Net Freshwater Intake
Total freshwater drawn from external sources per unit of production. This is the metric that regulators most often set targets against. In the EU and California, water-stressed industries face progressively lower allowed intake as 2026 regulations tighten.
Freshwater Intensity per Unit of Production
A normalized metric that lets investors compare sites with different output. For petrochemical refining, typical targets are 1–3 m³ of freshwater per ton of product. For data centers, the metric is liters per kilowatt-hour of computing output.
Discharge Quality Index
A composite metric of key effluent parameters (TDS, COD, SS, pH) versus regulatory limits. It captures how close the plant runs to its limits, not just whether it is compliant. A lower discharge quality index reflects better control and lower regulatory risk.
Internal Water Cost
Total cost of water management per unit of production, including freshwater purchase, chemical dosing, energy for treatment, membrane replacement, and disposal fees. This is the cost metric that finance teams increasingly want to see alongside ESG metrics.
Measurement Stacks That Back Each KPI
Each KPI needs a specific sensor stack:
| KPI | Required Sensor Stack |
|---|---|
| Water reuse ratio | Flow meters on intake and every recycle loop |
| Net freshwater intake | Flow on intake plus conductivity on reused streams |
| Freshwater intensity per unit | Flow on intake plus production meter |
| Discharge quality index | Conductivity, COD, SS, pH on final discharge |
| Internal water cost | Energy meter on treatment, chemical dosing, all of the above |
Shanghai ChiMay’s sensor portfolio covers each of these stacks, and the company’s application engineers help teams map specific sites to specific KPIs.
Why Sensor Grade Matters for Reporting
A reported water circularity number is only as credible as the measurements behind it. Grab samples once a week are fine for compliance in 2010. In 2026, auditors expect hourly trending, documented calibration, digital diagnostics, and an audit trail from sensor to report.
Key requirements:
- Digital signature on process values separate from sensor health diagnostics.
- Historian logging with documented calibration history.
- Sensor selection matched to actual chemistry, not catalog specifications.
- Alarm and drift analysis stored for the reporting period.
Executives whose teams can produce that documentation face far fewer questions in audit and disclosure reviews.
Comparative Snapshot: Reporting Maturity Levels
| Maturity Level | Typical Practice | KPI Accuracy | Audit Risk |
|---|---|---|---|
| Basic | Monthly grab samples | ±15% | High |
| Intermediate | Online pH and conductivity, weekly other parameters | ±8% | Moderate |
| Advanced | Continuous online SS, COD, flow, conductivity | ±3% | Low |
| Best in class | Sensor-first design, digital audit trail, cross-validated | ±1.5% | Very low |
Moving up the maturity ladder is less about spending more and more about spending smarter. A few well-placed sensors, chosen to the right specification, unlock the biggest reporting gains.
Case Numbers From Operating Plants
Operating plants that have matured their water circularity measurement to advanced or best-in-class typically report:
- 8–12% higher water reuse ratio within 18 months, because visibility into recycle loops reveals optimization opportunities.
- 15–25% reduction in freshwater intake for the same output.
- 30–40% fewer off-spec discharge events.
- Cleaner CDP Water scores and lower audit follow-up requests.
The common thread is that each gain begins with a credible measurement, not with a new technology project.
Board and Executive Engagement: Questions to Ask
Executive teams do not need to become sensor experts, but they do need to ask the right questions:
- Do we have a documented mapping from each reported KPI to a specific sensor stack?
- What is the measurement accuracy behind each KPI, and who owns it?
- How would our disclosure withstand an independent audit of the underlying data?
- Are our sensors selected for lifecycle performance and audit readiness, not only acquisition cost?
- How are we integrating sensor data into sustainability disclosures and investor communications?
Shanghai ChiMay’s briefing notes for executives provide a framework for these conversations, and the application engineering team supports the underlying sensor design decisions.
The 2026 Regulatory and Investor Context
The external pressures driving water circularity measurement continue to intensify:
- ISSB S2 disclosures now require data quality standards comparable to financial statements.
- CDP Water scores influence institutional investor decisions.
- India’s Central Pollution Control Board and China’s dual-control policies expect audited reuse ratios.
- EU’s Water Framework Directive updates push for circularity in industrial parks.
- Financial institutions increasingly tie loan pricing to circularity metrics.
Executives who treat water circularity KPIs as engineering artifacts will face increasing pressure. Those who treat them as reported business metrics, underpinned by credible measurement, will have a clear advantage.
Practical Executive Checklist
- Map each reported KPI to a specific sensor stack.
- Require digital diagnostic outputs on all critical sensors.
- Include five-year sensor maintenance and calibration in procurement.
- Align sensor selection with the regulatory frameworks that affect the business.
- Brief the board on the accuracy level of each KPI and the steps to improve it.
- Work with sensor partners who understand both engineering and reporting.
Conclusion
Water circularity in 2026 is no longer an engineering curiosity but a reported business metric that shapes valuation, investor confidence, and regulatory standing. The five KPIs that executives should know—water reuse ratio, net intake, freshwater intensity, discharge quality index, and internal water cost—each require a credible measurement stack. Shanghai ChiMay supports executive teams with sensor platforms, digital diagnostics, and application engineering that bridge the gap between plant-level measurement and company-level reporting. Executives who invest in that bridge today will find themselves better positioned against every regulatory and investor question that comes tomorrow.