Key Takeaways:
- Water disinfection relies on multiple mechanisms including oxidation, membrane damage, and protein denaturation
- Different disinfection technologies offer distinct advantages and limitations
- Understanding inactivation kinetics helps optimize treatment for specific pathogens
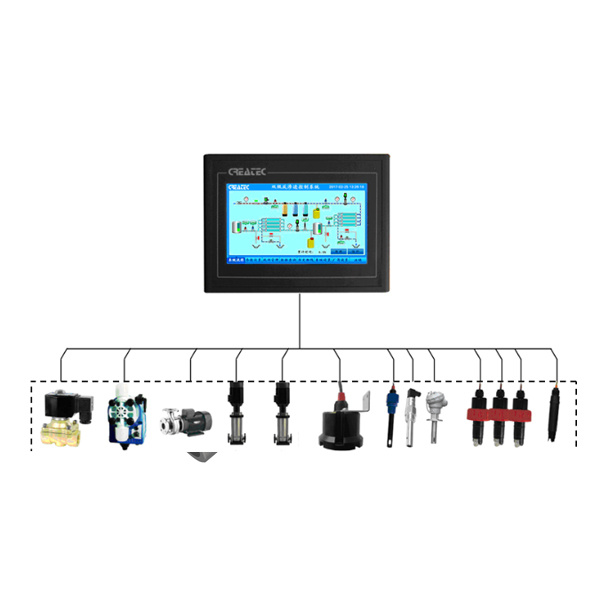
- ChiMay's comprehensive monitoring solutions support all major disinfection technologies
Table of Contents
Introduction
Water disinfection represents one of the greatest public health achievements of the modern era, preventing countless waterborne disease outbreaks and enabling urbanization on a global scale. Yet the science behind disinfection remains poorly understood by many water professionals. This comprehensive guide explains the fundamental mechanisms, technologies, and considerations that every water professional should master.
According to the U.S. Environmental Protection Agency (EPA), drinking water treatment has reduced waterborne disease incidence by over 95% since the implementation of modern disinfection practices. Understanding this science enables water professionals to optimize treatment, reduce costs, and ensure continued protection of public health.
Understanding Microbial Threats
Bacteria
Single-celled organisms capable of independent reproduction:
- Escherichia coli (E. coli): Indicator organism; some strains pathogenic
- Legionella pneumophila: Causes Legionnaires' disease
- Pseudomonas aeruginosa: Opportunistic pathogen; healthcare-associated infections
- Salmonella: Gastrointestinal illness; 1.35 million annual infections in the US
Viruses
Non-living particles requiring host cells for reproduction:
- Norovirus: Leading cause of viral gastroenteritis; 20 million annual cases in US
- Rotavirus: Leading cause of severe diarrhea in children
- Adenovirus: Respiratory and gastrointestinal illness
- Hepatitis A: Liver infection; 3,000-4,000 annual US cases
Protozoa
Single-celled parasites with resistant cyst stages:
- Cryptosporidium: Chlorine-resistant; 748,000 annual US infections
- Giardia lamblia: Beaver fever; 1.2 million annual US infections
- Entamoeba histolytica: Amoebic dysentery; 50 million annual global infections
| Pathogen | Size | Chlorine Resistance | UV Sensitivity |
|---|---|---|---|
| Bacteria | 0.5-5 μm | Low | High |
| Viruses | 0.02-0.3 μm | Moderate | High |
| Protozoa (cysts) | 3-15 μm | Very High | Moderate |
Disinfection Mechanisms
Oxidation
Chemical oxidants damage cellular components:
- Protein oxidation: Disrupts enzyme function
- Lipid peroxidation: Destroys cell membranes
- DNA damage: Prevents reproduction
- Cofactor oxidation: Interrupts metabolic pathways
Membrane Damage
Physical disruption of cellular barriers:
- Membrane permeabilization: Loss of cellular contents
- Oxidative membrane attack: Protein and lipid damage
- Electrostatic disruption: Alters membrane potential
Protein Denaturation
Structural disruption of functional proteins:
- Enzyme inactivation: Stops metabolic processes
- Structural protein damage: Weakens cellular structure
- Transport protein disruption: Impairs nutrient transport
Reaction Kinetics
Chick's Law
First-order inactivation kinetics describe most disinfection processes:
N = N₀ × e^(-k × C × t)
Where:
- N = Number of surviving organisms
- N₀ = Initial number of organisms
- k = Inactivation rate constant
- C = Disinfectant concentration
- t = Contact time
CT Concept
Disinfection dose is expressed as concentration multiplied by time:
- Higher concentration allows shorter contact time
- Lower concentration requires longer contact time
- Balance needed between chemical cost and contact time
The EPA establishes minimum CT values for specific log inactivation of each pathogen type.
Chlorine Disinfection
Chemistry of Chlorine
Hypochlorous Acid Formation
When chlorine dissolves in water, it forms hypochlorous acid:
Cl₂ + H₂O → HOCl + H⁺ + Cl⁻
HOCl dissociates at higher pH:
HOCl ⇌ H⁺ + OCl⁻
Relative Disinfection Power
HOCl is approximately 100 times more effective than OCl⁻ at equivalent concentrations due to its uncharged nature, which facilitates cell membrane penetration.
Chlorine Effectiveness Factors
pH Effects
pH dramatically affects chlorine disinfection:
| pH | HOCl % | OCl⁻ % | Relative Effectiveness |
|---|---|---|---|
| 6.0 | 97% | 3% | Excellent |
| 7.0 | 72% | 28% | Good |
| 7.5 | 50% | 50% | Moderate |
| 8.0 | 20% | 80% | Reduced |
Temperature Effects
Higher temperatures increase reaction rates but decrease residual persistence:
- Reaction rate: Doubles for every 10°C increase
- Decay rate: Increases with temperature
- Optimal range: 15-25°C for most applications
Ammonia Interactions
Ammonia reacts with chlorine to form chloramines:
- Monochloramine (NH₂Cl): Primary combined chlorine species
- Dichloramine (NHCl₂): Forms at lower pH
- Trichloramine (NCl₃): Forms at very low pH; volatile
ChiMay's pH meters provide accurate measurement for optimizing chlorine effectiveness.
Chlorine Byproducts
Trihalomethanes (THMs)
Formed when chlorine reacts with organic matter:
- Chloroform: Potentially carcinogenic
- Bromodichloromethane: Regulated at 80 μg/L
- Dibromochloromethane: Regulated at 80 μg/L
- Bromoform: Regulated at 80 μg/L
Haloacetic Acids (HAAs)
Second major class of chlorine byproducts:
- Monochloroacetic acid
- Dichloroacetic acid
- Trichloroacetic acid
- Regulated at 60 μg/L total
Managing Byproducts
Control strategies include:
- Optimize coagulation to remove organic precursors
- Consider chloramines for residual maintenance
- Use ozone or UV as primary disinfectant
- Balance microbial protection with byproduct control
UV Disinfection
Physics of UV Light
Germicidal Wavelengths
UV light at 200-300 nm damages microbial DNA/RNA:
- Peak effectiveness: 253.7 nm
- Mechanism: Pyrimidine dimer formation
- Effect: Prevents DNA replication
Penetration Limitations
UV effectiveness depends on water clarity:
- High UVT (>85%): Excellent penetration
- Moderate UVT (70-85%): Good penetration
- Low UVT (<70%): Reduced effectiveness
- Turbidity: Shields organisms from UV exposure
UV Dose-Response
Dose Calculation
UV dose = UV intensity × exposure time
Units: mW/cm² × seconds = mJ/cm²
Log Inactivation Requirements
| Pathogen | Target Log | UV Dose (mJ/cm²) |
|---|---|---|
| E. coli | 3-log | 5.5 |
| Rotavirus | 3-log | 14-24 |
| Cryptosporidium | 3-log | 2.5 |
| Giardia | 3-log | 1.9 |
| Adenovirus | 3-log | 165 |
The EPA requires minimum validation dose of 12 mJ/cm² for bacteria and viruses, with higher doses for protozoa based on treatment objectives.
UV System Components
Lamp Technologies
Low-Pressure Mercury
- Single wavelength (253.7 nm)
- Lower power output
- Good efficiency
- Standard for most applications
Low-Pressure High-Output (LPHO)
- Enhanced power output
- Same wavelength
- Higher UV intensity
- Reduced reactor size
Medium-Pressure Mercury
- Multiple wavelengths
- Higher power
- Broader spectrum
- Larger reactors
Amalgam Lamps
- Advanced low-pressure design
- Higher power density
- Longer life
- Growing market share
Reactor Design
Key components include:
- Quartz sleeves protecting lamps
- Reactors optimized for hydraulic efficiency
- UV sensors for monitoring
- Cleaning systems for sleeve maintenance
Ozone (O₃) generated by:
- Corona discharge: Most common method
- UV radiation: Lower efficiency
- Electrochemical: Emerging technology
Decomposition
Ozone decomposes rapidly in water:
O₃ → O₂ + [O] (atomic oxygen)
Atomic oxygen reacts with water:
[O] + H₂O → 2OH• (hydroxyl radicals)
Hydroxyl radicals are extremely reactive, providing 1,000 times greater oxidation potential than ozone itself.
Ozone Effectiveness
Advantages
- Most powerful oxidant commonly used in water treatment
- Effective against all pathogen types
- No persistent residual
- Breaks down many organic contaminants
Limitations
- No residual protection in distribution
- Rapid decay requires immediate measurement
- Bromate formation risk in bromide-containing waters
- Higher capital and operating costs
ChiMay's ORP monitors support ozone system optimization by tracking oxidative potential.
Ozone Byproducts
Bromate Formation
Bromide oxidation produces bromate:
Br⁻ → BrO₂⁻ (bromite) → BrO₃⁻ (bromate)
Risk Factors
- High bromide concentration
- High ozone dose
- High pH
- Long contact time
Control Strategies
- Reduce ozone dose
- Lower pH during ozonation
- Add ammonia to convert bromide to bromamine
- Pretreat to remove bromide
Chloramine Disinfection
Chloramine Formation
Chloramines form when chlorine reacts with ammonia:
NH₃ + HOCl → NH₂Cl + H₂O
Species Distribution
| Species | pH 6-8 | pH < 6 | pH > 9 |
|---|---|---|---|
| Monochloramine | Primary | Secondary | Primary |
| Dichloramine | Secondary | Primary | Trace |
| Trichloramine | Trace | Secondary | None |