Key Takeaways:
- RO system efficiency degrades by 1-3% annually without proper monitoring
- Online conductivity monitoring reduces membrane cleaning frequency by 30-40%
- Normalized conductivity analysis extends membrane life by 15-25%
Reverse osmosis (RO) membrane technology has become the workhorse process for desalination, water reuse, and ultrapure water production worldwide. From municipal desalination plants processing millions of gallons daily to industrial facility wastewater recovery systems, RO provides exceptional contaminant rejection with relatively low energy consumption.
However, RO systems are sensitive to operating conditions and prone to performance decline from membrane fouling, scaling, and degradation. Inline conductivity meters provide the critical monitoring data that enables operators to maintain system performance, anticipate maintenance needs, and maximize membrane service life.
Table of Contents
Understanding RO Conductivity Principles
Conductivity Fundamentals
Electrical conductivity measures water ability to conduct electrical current, directly proportional to dissolved ion concentration:
Relationship to Total Dissolved Solids (TDS):
TDS (mg/L) = Conductivity (μS/cm) × Conversion Factor
The conversion factor varies with water composition:
- Pure water: 0.50-0.60
- Typical freshwater: 0.55-0.70
- Seawater: 0.64-0.80
- High bicarbonate waters: 0.70-0.85
For most RO applications, operators use site-specific calibration establishing accurate conversion factors.
Conductivity and Membrane Performance
Membrane salt rejection determines product water quality:
Salt Rejection (%) = [(Influent conductivity – Permeate conductivity) / Influent conductivity] × 100
Typical rejection values:
| Membrane Type | Salt Rejection | Application |
|---|---|---|
| Cellulose Acetate | 90-95% | Seawater |
| Thin Film Composite | 95-99% | Brackish water, tap water |
| High-Rejection TFC | 99-99.5% | Food, pharmaceutical |
| Nanofiltration | 50-90% | Partial softening, color removal |
Normalized Performance Analysis
Conductivity data enables performance normalization, accounting for changing conditions:
Normalized Permeate Conductivity (NPC):
NPC = Measured permeate conductivity × (Corrected feed pressure / Standard pressure) × (Standard temperature conductivity / Corrected feed conductivity)
Normalized Salt Passage (NSP):
NSP = 100 – Normalized salt rejection
Key insight: When normalized values increase by 15-20% from baseline, membrane cleaning is typically warranted.
Inline Conductivity Measurement Technology
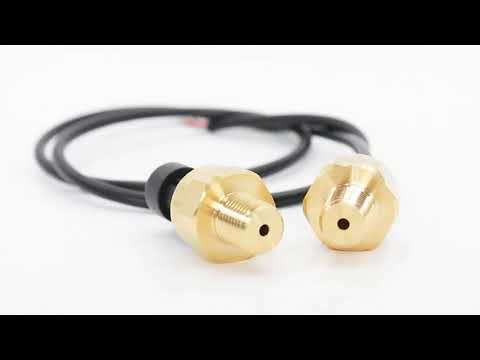
Electrode Design Options
Two-electrode cells:
- Simple construction, lower cost
- Susceptible to polarization at high conductivity
- Suitable for low-conductivity applications (<100 μS/cm)
Four-electrode cells:
- Eliminates polarization errors
- Maintains accuracy despite electrode fouling
- Preferred for most RO applications
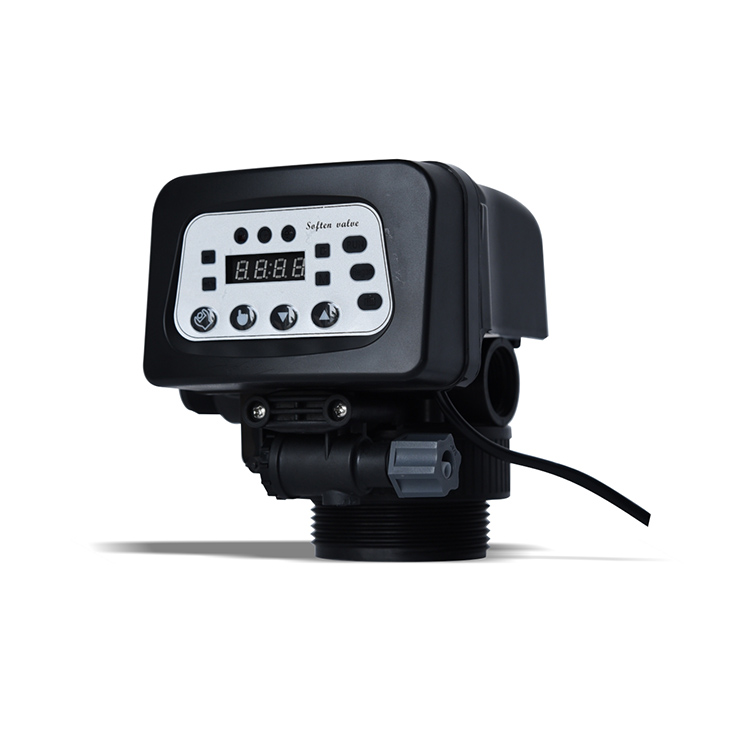
ChiMay's inline conductivity meter uses four-electrode technology:
- Measurement range: 0.01 μS/cm to 200 mS/cm (auto-ranging)
- Accuracy: ±0.5% of reading
- Temperature compensation: Automatic, multiple reference temperatures
- Cell constant: Factory-calibrated, field-verified
Installation Considerations
Flow-through cells:
- Sample flow rate: 100-500 mL/min prevents stagnation
- Orientation: Horizontal or vertical depending on design
- Bypass configuration: Allows sensor removal without system shutdown
- Cell volume: Minimizes response time
Submersible sensors:
- Direct tank or pipe mounting
- Reduced installation cost
- Faster response to changes
- Risk of fouling in process streams
Calibration Procedures
Standard solutions for calibration:
| Range | Standard | Frequency |
|---|---|---|
| Ultrapure water | 0.1-1 μS/cm (deionized water) | Monthly |
| Low conductivity | 84 μS/cm (0.001 M KCl) | Monthly |
| Standard range | 1,413 μS/cm (0.01 M KCl) | Quarterly |
| High conductivity | 12,850 μS/cm (0.1 M KCl) | Quarterly |
RO System Monitoring Strategy
Critical Monitoring Points
Feed water conductivity:
- Purpose: Load monitoring, concentrate stream calculation
- Implications: High feed conductivity stresses membranes, reduces recovery
Permeate conductivity:
- Purpose: Product quality verification, alarm generation
- Implications: Conductivity spikes indicate membrane damage or seal failures
Concentrate conductivity:
- Purpose: Recovery calculation, scaling potential assessment
- Implications: High concentrate conductivity risks precipitation
System performance monitoring:
Typical monitoring configuration for 3-stage RO system:
| Location | Parameter | Alarm Setpoint |
|---|---|---|
| Feed inlet | Conductivity | High limit |
| Stage 1 permeate | Conductivity | Individual alarm |
| Stage 2 permeate | Conductivity | Individual alarm |
| Final permeate | Conductivity | Product quality |
| Mixed concentrate | Conductivity | Recovery calculation |
Scaling and Fouling Detection
Conductivity ratios reveal scaling tendency:
Concentration Factor (CF):
CF = Concentrate conductivity / Feed conductivity
Scaling risk thresholds:
| CF Value | Risk Level | Recommended Action |
|---|---|---|
| <2 | Low | Normal operation |
| 2-3 | Moderate | Monitor closely |
| 3-4 | High | Consider antiscalant adjustment |
| >4 | Very High | Immediate intervention required |
Temperature-compensated conductivity removes variable effects:
- Raw water conductivity varies approximately 2% per °C
- RO rejection characteristics vary with temperature
- Normalization enables apples-to-apples performance comparison
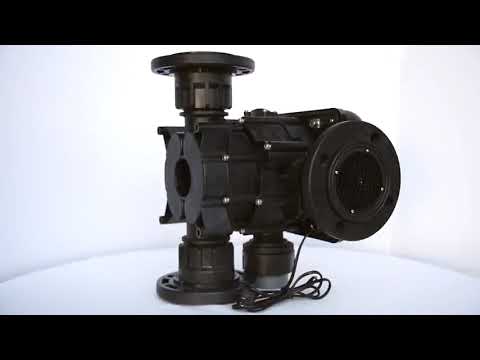
RO System Control Integration
Conductivity-Based Control Actions
Automatic valve control:
- Permeate diversion: Diverting off-spec product to drain
- Concentrate throttling: Adjusting concentrate flow to maintain recovery
- Flush sequence initiation: Triggering cleaning cycles based on fouling indicators
Dosing system integration:
- Antiscalant dosing: Adjusting based on concentrate conductivity ratios
- Acid dosing: Modulating pH adjustment based on conductivity trends
- Biocide feeds: Triggering based on conductivity indicating biofouling
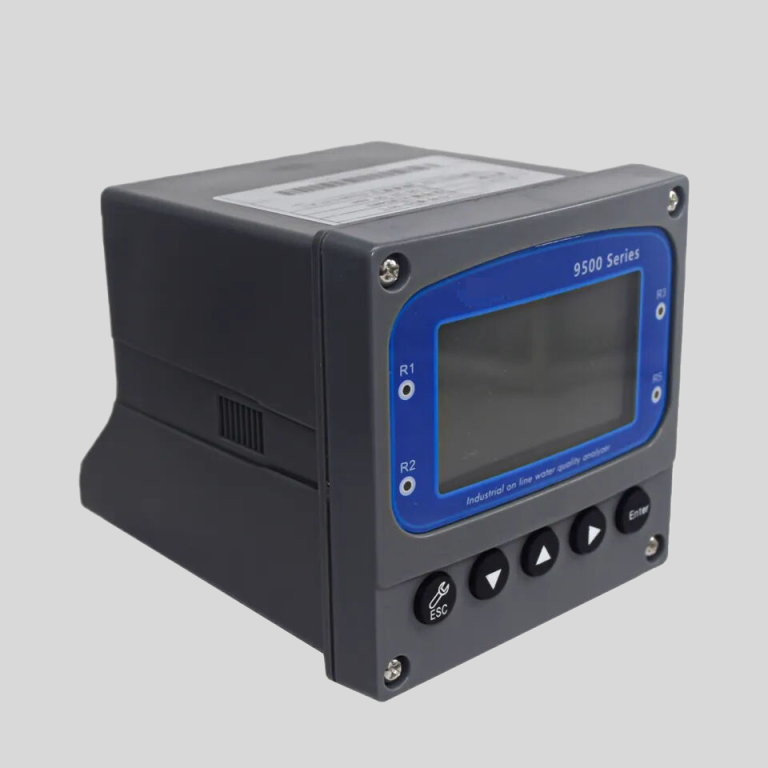
SCADA and Control System Integration
Communication protocols:
| Protocol | Application | Notes |
|---|---|---|
| 4-20mA | Analog control loops | Universal compatibility |
| HART | Smart instrument integration | Digital data plus analog |
| Modbus RTU | Serial communication | Common in PLC systems |
| Modbus TCP | Ethernet communication | Modern installations |
| Foundation Fieldbus | Fieldbus systems | Process industry standard |
Data logging requirements:
- Continuous recording: At minimum 1-minute intervals
- Event logging: Alarms, setpoint changes, cleaning cycles
- Trend analysis: Historical comparison for degradation tracking
- Reporting: Compliance documentation, performance reports
Membrane Cleaning Optimization
Cleaning Trigger Determination
Normalized performance decline indicates cleaning need:
| Normalized Salt Passage Increase | Cleaning Recommendation |
|---|---|
| <10% | Monitor closely |
| 10-20% | Schedule cleaning within 2 weeks |
| >20% | Clean immediately |
| >50% | Inspect membranes for damage |
ChiMay RO system controller integrates conductivity monitoring with cleaning optimization:
- Automatic cleaning trigger based on performance decline
- Cleaning cycle sequencing for multiple stages
- Chemical dosing integration for cleaning solutions
- Post-cleaning verification ensuring restoration
Cleaning Solution Selection
Based on foulant type identified from conductivity patterns:
| Foulant Type | Conductivity Signature | Cleaning Solution |
|---|---|---|
| Calcium carbonate | High concentrate, rapid scaling | Acid (pH 2-4) |
| Sulfate scale | Very high concentrate conductivity | Acid plus chelating agent |
| Organic fouling | Moderate, gradual increase | Alkaline plus surfactants |
| Biofilm | Variable, inconsistent | Biocide plus alkaline |
| Silica | High temperature, slow buildup | Specialized silica cleaners |
Economic Analysis
Consider a food processing facility with 200 GPM RO system:
Current operating state:
- Product water: 150 GPM at 150 μS/cm
- Recovery rate: 75%
- Membrane life: 4 years (cleaning every 6 months)
- Annual membrane replacement cost: $45,000
- Annual cleaning cost: $18,000
- Energy cost: $95,000/year
Investment in conductivity monitoring:
- 6 inline conductivity sensors: $12,000
- RO system controller upgrade: $8,000
- Integration and commissioning: $4,000
- Total investment: $24,000
Projected improvements:
| Category | Improvement | Annual Value |
|---|---|---|
| Extended membrane life | 5 years (+25%) | $9,000 |
| Reduced cleaning frequency | 30% fewer cleanings | $5,400 |
| Energy optimization | 8% reduction | $7,600 |
| Product quality | Reduced off-spec product | $12,000 |
| Labor savings | Reduced manual monitoring | $4,000 |
| Total annual savings | $38,000 |
ROI: 158%
Payback period: 8 months
5-year savings: $166,000 (net of initial investment)
Troubleshooting Guide
Common Conductivity Measurement Problems
| Symptom | Possible Cause | Corrective Action |
|---|---|---|
| Reading drift | Fouled electrodes | Clean with appropriate solution |
| Erratic readings | Air bubbles | Ensure proper flow, deaerate sample |
| High zero reading | Contaminated cell | Ultrasonic cleaning, recalibrate |
| No response | Electronic failure | Check wiring, replace sensor |
| Slow response | Cell fouling | Clean, check flow rate |
RO System Conductivity Issues
| Symptom | Possible Cause | Corrective Action |
|---|---|---|
| High permeate conductivity | Membrane damage | Pressure test, inspect elements |
| Increasing salt passage | Biofouling or organic | Clean with appropriate solution |
| Rapid scaling | High recovery, low antiscalant | Reduce recovery, check dosing |
| Variable conductivity | Inconsistent feed | Check feed water conditions |
| Stage 1 worse than others | Concentrate channeling | Inspect spacers, replace elements |
Best Practices Summary
- Install calibrated sensors at critical points throughout RO train
- Normalize data for pressure and temperature variations
- Establish baselines during initial operation and after cleaning
- Monitor trends rather than absolute values for early warning
- Integrate with control systems for automated response
- Maintain regularly per manufacturer specifications
- Document performance for regulatory and troubleshooting purposes
Inline conductivity monitoring provides the essential data for RO system optimization. From product quality assurance to membrane life extension, conductivity measurement enables informed decision-making that improves system performance while reducing operating costs. Investment in quality sensors and control integration generates compelling returns through extended membrane life, reduced cleaning frequency, and optimized energy consumption.