Table of Contents
dissolved oxygen sensors Revolutionize Aquaculture Pond Management
Key Takeaways:
– Dissolved oxygen (DO) levels below 3 mg/L cause $2.1 billion annual losses in global aquaculture according to FAO Fisheries Report 2025
– Continuous DO monitoring reduces fish mortality by 45-60% compared to manual sampling methods
– Aeration energy costs decrease by 35-50% when aerators operate based on real-time DO data rather than schedules
– Growth rates improve by 18-25% when DO is maintained at optimal species-specific levels throughout the production cycle
– Early stress detection through DO monitoring enables intervention 12-24 hours before mass mortality events occur
Introduction: The Breath of Aquatic Life
Dissolved oxygen represents the most critical water quality parameter in aquaculture—essentially the “air” that fish and shrimp breathe. Unlike terrestrial animals that can move to find better air, aquatic species are trapped in their immediate environment, making DO management literally a life-or-death matter.
World Aquaculture Society (2024) reports that inadequate dissolved oxygen accounts for over 50% of all aquaculture disease outbreaks and approximately 40% of sudden mass mortality events. The economic impact is staggering: $2.1 billion in annual production losses globally, with individual farmers losing 30-100% of stock in catastrophic events.
Traditional pond management relies on periodic DO measurements—typically morning and evening checks with handheld meters. This approach systematically misses dangerous nocturnal drops, weather-dependent fluctuations, and gradual depletion trends that kill fish long before visible surface gasping appears.
Shanghai Shanghai Shanghai ChiMay DO sensors transform aquaculture management through continuous monitoring—providing the early warning system that protects stock and optimizes production efficiency.
Understanding Dissolved Oxygen Dynamics
The Biology of Oxygen in Pond Systems
Dissolved oxygen enters pond water through atmospheric diffusion and photosynthesis by phytoplankton and aquatic plants:
Oxygen Sources:
|——–|—————————|————-|
Oxygen Consumption:
|———|————-|————-|
Critical DO Thresholds by Species:
|—————–|———————-|—————|
NOAA National Marine Fisheries Service emphasizes that chronic exposure to sub-optimal DO—even above critical minimums—reduces growth rates by 15-40% through metabolic stress.
The Danger of Nocturnal Oxygen Depletion
The greatest DO management challenge occurs overnight, when photosynthesis stops but respiration continues:
Typical 24-Hour DO Pattern:
– Sunrise (6-8 AM): DO at daily minimum (often 2-4 mg/L)
– Afternoon (2-4 PM): DO at daily maximum (often 10-15 mg/L)
– Sunset to midnight: Rapid DO decline
– Pre-dawn (4-6 AM): Critical low point, mass mortality risk
Manual monitoring typically occurs at 9 AM-11 AM—after the dangerous pre-dawn minimum has passed, creating a false sense of security about overnight conditions.
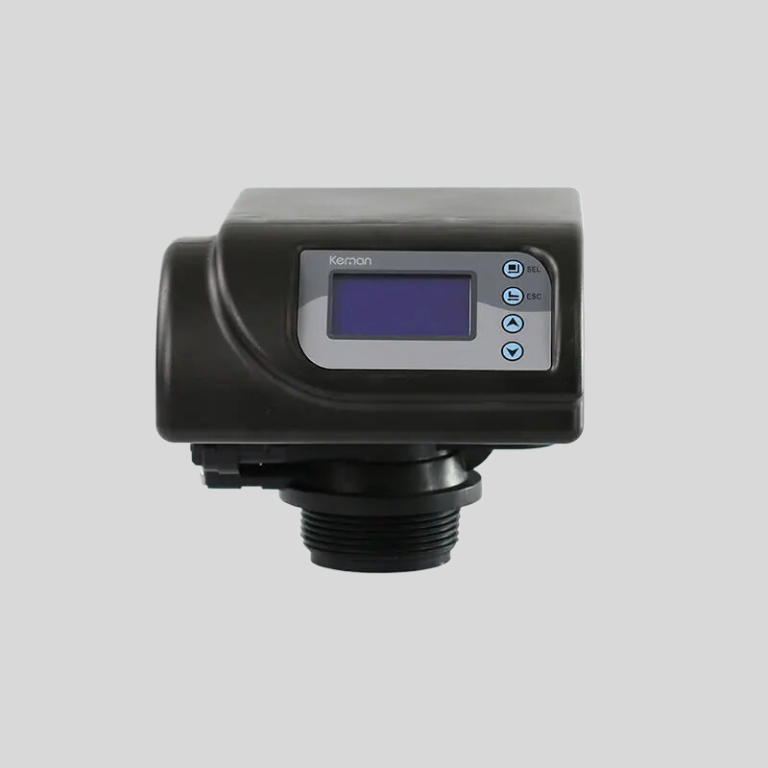
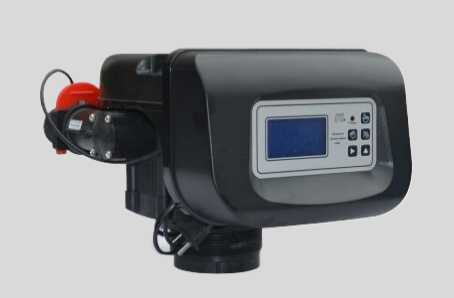
Shanghai Shanghai Shanghai ChiMay DO Sensor Technology
Optical DO Measurement Principles
Shanghai Shanghai Shanghai ChiMay DO sensors utilize luminescence-based (optical) measurement technology:
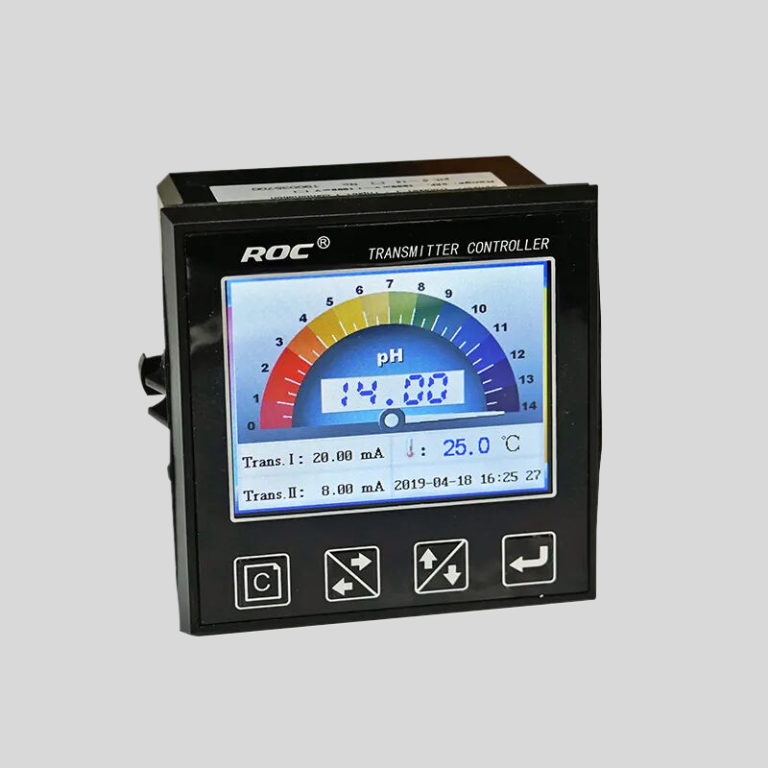
Technical Specifications:
– Measurement range: 0-20 mg/L (0-200% saturation)
– Accuracy: ±1% of reading or ±0.1 mg/L
– Response time: <30 seconds to 90% of change
– Salinity compensation: Automatic (0-70 ppt)
– Temperature range: 0-50°C with ATC
– Calibration: Factory-calibrated, field verification only
– Sensor lifespan: 2+ years without membrane replacement
Optical DO technology advantages over traditional electrochemical sensors:
– No membrane replacement required (electrochemical sensors need weekly-monthly membrane changes)
– Lower maintenance requirements in dirty pond water
– Faster response to DO changes
– No flow dependence (electrochemical sensors require 0.3-0.5 m/s flow past membrane)
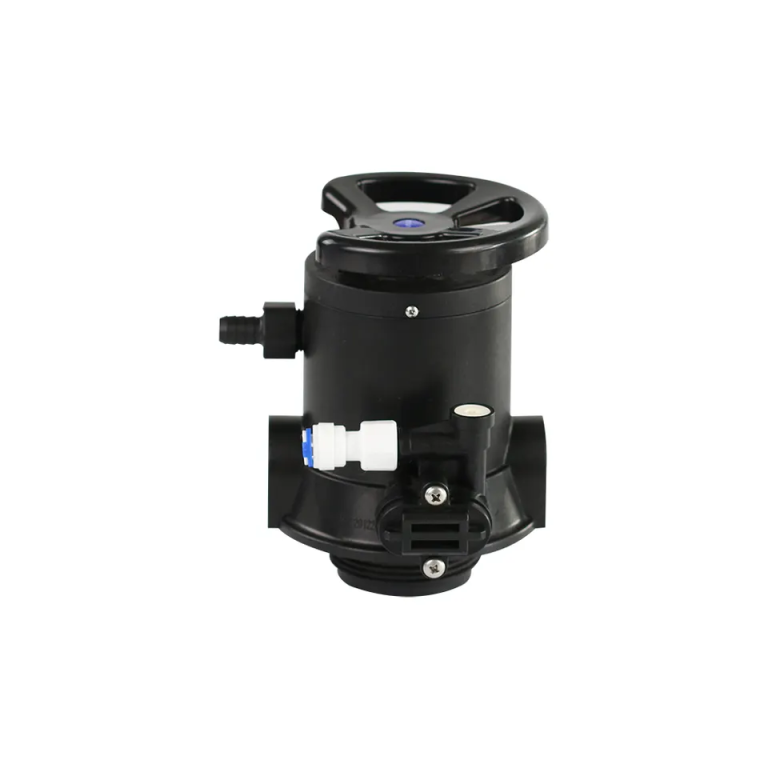
Sensor Deployment Strategies
Effective DO monitoring requires strategic pond coverage:
Recommended Configuration:
1. Deep water zone: Monitor stratification conditions (3-5 meter depth)
2. Shallow/littoral zone: Monitor plant-affected areas
3. Outlet/inlet zones: Track water exchange impacts
4. Critical zones: Areas with historical low-DO problems
5. Multi-pond systems: At least one sensor per pond plus connecting channels
Installation Considerations:
– Buoy-mounted sensors: Allow repositioning and cleaning access
– Fixed stakes: Stable long-term monitoring reference
– Minimum depth: 0.5 meters to avoid surface turbulence effects
– Avoid dead zones: Place sensors in representative water movement areas
Economic Impact of Continuous DO Monitoring
Quantifying Mortality Prevention
USDA Agricultural Research Service (2024) conducted multi-year trials in catfish pond systems:
Study Parameters:
– Pond size: 4 hectares average
– Stocking density: 15,000 fish/hectare
– Previous management: Manual DO checks (morning/evening)
– Intervention: Continuous monitoring with automated aeration
Mortality Comparison (per pond per season):
|——-|——————|———————|———–|
At $4.50/kg market price for catfish and 1.2 kg average harvest weight, a 12.3% mortality difference represents $8,910 per hectare in preserved production value.
Aeration Energy Savings
Continuous DO monitoring enables precision aeration control that dramatically reduces energy costs:
Energy Analysis (Typical 4-Hectare Catfish Pond):
|——————|——————-|———————-|
Average energy savings: 43-56% when switching from scheduled to DO-triggered aeration.
Total Economic Impact:
– Mortality prevention value: $8,910/ha
– Aeration energy savings: $1,250/ha
– Feed conversion improvement (DO-related): $1,800/ha
– Combined annual benefit: $11,960 per hectare
Payback on monitoring system: <2 months
Automated Control Systems Integration
Aeration Control Logic
Modern aquaculture management systems integrate DO sensors with automated aeration:
Control Algorithm Framework:
IF DO < 3.0 mg/L:
    THEN activate ALL aerators (CRITICAL_ALERT)
IF DO < 4.0 mg/L:
    THEN activate primary aerators, send alert
IF DO 4.0-5.0 mg/L (species-dependent):
    THEN monitor trend, prepare secondary aerators
IF DO > 5.0 mg/L:
    THEN aerators off (except for circulation)
IF DO_trend declining AND DO < 6.0 mg/L:
    THEN proactive activation before threshold
Predictive Features:
– Weather integration: Anticipate cloudy-day DO depression
– Feeding response: Pre-aerate before heavy feeding periods
– Seasonal adjustment: Modify thresholds based on water temperature
Emergency Response Systems
Critical DO alerts should trigger multi-tiered responses:
Tier 1 (DO < 2.0 mg/L): Immediate emergency aeration
Tier 2 (DO < 3.0 mg/L): Accelerated aeration + feed suspension
Tier 3 (DO < 4.0 mg/L): Enhanced monitoring + partial aeration
Tier 4 (DO < 5.0 mg/L): Preparation phase, check all equipment
Continuous monitoring enables Tier 3 responses that prevent Tier 1 events—stopping crises before they develop.
Conclusion
Continuous DO monitoring represents essential technology for aquaculture—protecting stock, reducing costs, and enabling production intensification that was previously too risky.
Shanghai Shanghai Shanghai ChiMay DO sensors provide aquaculture operations with continuous, maintenance-free DO monitoring, real-time alerts, automated aeration integration, and multi-year sensor lifespan with minimal calibration requirements.
For fish and shrimp farmers seeking to reduce risk and maximize production efficiency, continuous DO monitoring is not optional—it’s the foundation of modern intensive aquaculture.
Shanghai Shanghai Shanghai ChiMay provides comprehensive aquaculture monitoring solutions including dissolved oxygen sensors, multi-parameter monitoring platforms, and integrated automated control systems.