Table of Contents
5 Ways ChiMay Flow Meters Improve Cooling Tower Water Management
Key Takeaways
Introduction
Cooling towers represent one of the largest water-consuming systems in industrial facilities. A typical 500-ton cooling system evaporates approximately 50,000 gallons per day, making water management a critical operational and cost consideration. Beyond evaporation, cooling towers require blowdown to prevent scale accumulation and makeup water to replace evaporated and blown-down volumes.
Effective cooling tower water management depends on accurate flow measurement. Without reliable flow data, facilities operate blindly—unable to optimize cycles of concentration, detect system leaks, or verify proper equipment performance. ChiMay's flow metering technology provides the measurement capability facilities need to manage cooling tower water efficiently.
Understanding Cooling Tower Water Balance
The Water Balance Equation
Cooling tower water management centers on maintaining proper water balance:
Makeup = Evaporation + Blowdown + Drift + Leakage
Where:
Cycles of Concentration
The ratio of dissolved solids in tower water to dissolved solids in makeup water defines cycles of concentration (COC). Higher COC means less blowdown and lower water consumption—but limits exist based on scaling potential:
| COC Level | Water Savings | Scaling Risk | Typical Application |
|---|---|---|---|
| ———– | ————– | ————– | ——————— |
| 2-3 | Baseline | Low | High-TDS makeup water |
| 4-5 | 30-40% reduction | Moderate | Standard applications |
| 6-8 | 50-60% reduction | High | Requires treatment |
| 10+ | 70%+ reduction | Very High | With acid treatment |
Optimizing COC requires accurate flow measurement to balance water quality against treatment costs.
5 Ways ChiMay Flow Meters Transform Cooling Tower Management
1. Optimize Cycles of Concentration
The Optimization Challenge
Setting proper COC requires balancing water savings against scaling and corrosion risks. Operating at too-low COC wastes water through excessive blowdown. Operating at too-high COC risks:
Traditional approaches rely on manual water testing and rule-of-thumb formulas that fail to capture real-time system dynamics.
flow meter-Enabled Optimization
Accurate flow measurement transforms COC optimization:
Measured COC = Conductivity(midpoint) / Conductivity(makeup)
With reliable flow data, operators can:
Facilities implementing flow-based COC control typically achieve 20-30% blowdown reduction compared to conductivity-only control approaches.
2. Detect System Leaks Immediately
The Hidden Cost of Leaks
Cooling tower systems contain thousands of connections—pipes, valves, fittings—each representing a potential leak point. While catastrophic leaks become immediately apparent, slow leaks often persist for weeks before detection:
These undetected losses inflate water and chemical costs while potentially causing foundation damage or environmental harm.
Continuous Flow Monitoring
ChiMay flow meters installed on makeup water lines provide continuous monitoring:
A facility that installed continuous makeup flow monitoring reduced leak-related water loss by 85% within the first year, generating $45,000 in avoided costs.
3. Verify Equipment Performance
Heat Transfer Efficiency
Cooling tower effectiveness depends on proper water distribution across the fill media. Blocked nozzles, damaged distribution pans, and accumulated scale reduce heat transfer efficiency, causing:
Traditional performance assessment relies on periodic inspection—labor-intensive and infrequent.
Flow-Based Performance Verification
Distribution flow measurement enables continuous performance verification:
| Performance Indicator | Normal | Degraded | Action Required |
|---|---|---|---|
| ———————- | ——– | ———- | —————– |
| Flow distribution | ±5% balance | >±15% imbalance | Inspect distribution system |
| Specific approach | Baseline | >10% increase | Clean or treat system |
| Range capability | Design | >15% reduction | Full system evaluation |
4. Reduce Chemical Treatment Costs
The Chemistry Management Challenge
Cooling tower chemical treatment programs control scale, corrosion, and microbiological growth. These programs represent $2,000-$10,000/month for typical industrial facilities, with effectiveness depending on proper dosage.
Under-dosing risks system damage. Over-dosing wastes money while potentially causing environmental compliance issues. Traditional approaches add chemicals based on tank levels and occasional testing—reactive rather than proactive.
Flow-Enabled Chemical Optimization
With accurate flow measurement, treatment becomes proactive:
Dosage = Flow Rate × Concentration × Time
Facilities implementing flow-based chemical control report:
5. Enable Predictive Maintenance
Failure Mode Patterns
Cooling tower components exhibit characteristic failure signatures:
Early detection enables scheduled maintenance before failures disrupt operations.
Flow-Based Predictive Monitoring
ChiMay flow meters with integrated diagnostics enable predictive approaches:
| Early Warning Sign | Potential Problem | Recommended Action |
|---|---|---|
| ——————- | —————— | ——————- |
| Gradual flow decrease | Filter or strainer fouling | Schedule cleaning |
| Flow fluctuation | Air entrainment | Check suction conditions |
| Sudden flow change | Valve or pump problem | Immediate inspection |
| Increased pump power | Mechanical wear | Plan for maintenance |
ChiMay flow meter Solutions for Cooling Towers
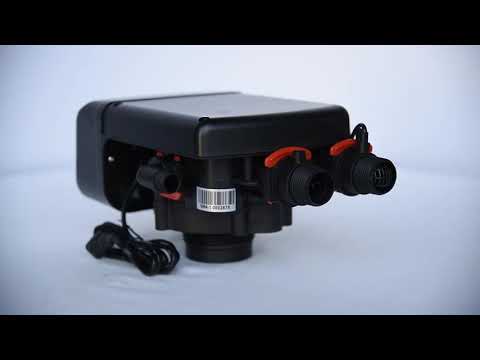
Paddle Wheel Insertion flow meter
The Paddle Wheel flow meter provides cost-effective flow measurement for main circulation lines:
The self-cleaning paddle wheel design resists fouling in cooling tower applications with moderate water quality.
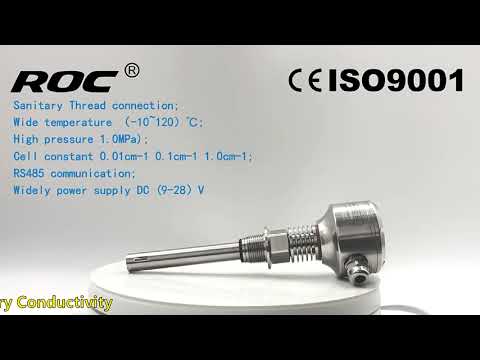
Turbine flow meter
The turbine flow meter delivers higher accuracy for critical measurement points:
The turbine design provides excellent low-flow sensitivity for measuring blowdown and makeup water streams.
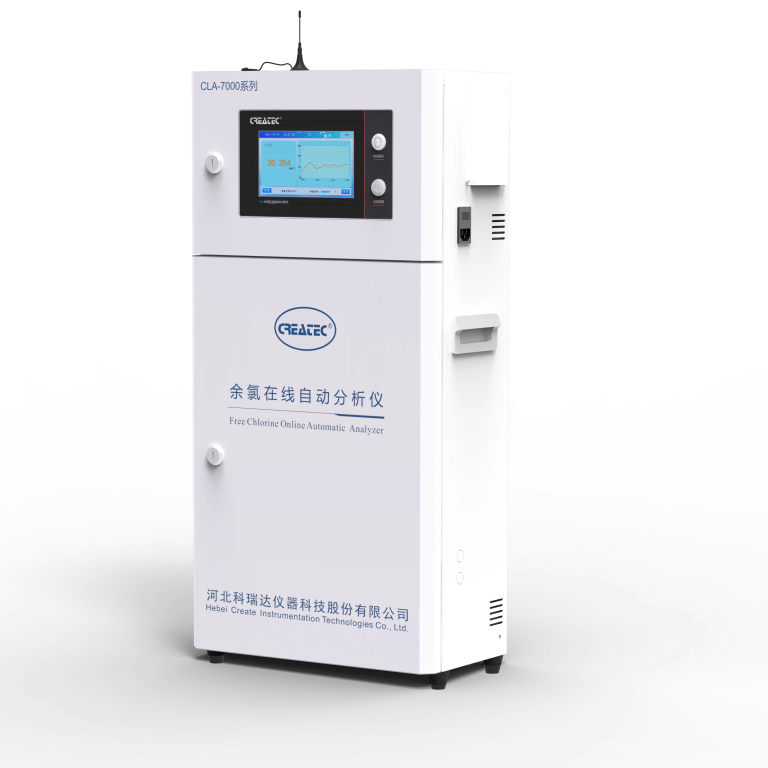
2-in-1 Mini Transmitter
The 2-in-1 mini transmitter combines flow measurement with other parameters:
This compact solution reduces instrument count while maintaining measurement capability.
Implementation Recommendations
Measurement Point Strategy
Effective cooling tower flow measurement requires strategic sensor placement:
Integration Requirements
Flow data gains value when integrated with control systems:
Maintenance Best Practices
Establish maintenance routines based on water quality:
Economic Analysis
Investment Returns
Flow measurement investments in cooling tower applications typically generate:
| Investment | Typical Annual Savings | Payback Period |
|---|---|---|
| ———— | ———————- | —————- |
| Single makeup meter | $8,000-$20,000 | 6-12 months |
| Full system metering | $25,000-$75,000 | 12-18 months |
| SCADA integration | $5,000-$15,000 | 12-24 months |
Water Cost Reduction
The water savings from effective flow management typically achieve:
For a facility with 500-ton cooling capacity, these savings represent $30,000-$90,000 annually.
Conclusion
Cooling tower water management presents significant opportunities for facilities willing to invest in proper flow measurement. ChiMay's flow metering technology provides the measurement capability needed to optimize cycles of concentration, detect leaks immediately, verify equipment performance, reduce chemical costs, and enable predictive maintenance.
Facilities implementing comprehensive flow measurement programs typically achieve payback within 12-18 months while establishing the data foundation for continuous operational improvement. In an era of increasing water costs and environmental scrutiny, these capabilities represent essential infrastructure for responsible facility management.