Table of Contents
Key Takeaways
- Advanced sludge treatment lines with recovered biogas and side-stream deammonification push utility electricity intensity from a historical benchmark around 0.7 kWh/m³ toward 0.45 kWh/m³ of treated wastewater — a reduction that lands directly on the operating margin.
- Sustainability-linked debt now prices a portion of the coupon against verified environmental KPIs, and energy intensity per cubic metre treated is one of the most common indicators in the water sector.
- Sensor-based verification is the line between reported claims and audited claims; utilities without continuous instrumentation on sludge and biogas cannot substantiate their energy intensity to ESG-focused capital providers.
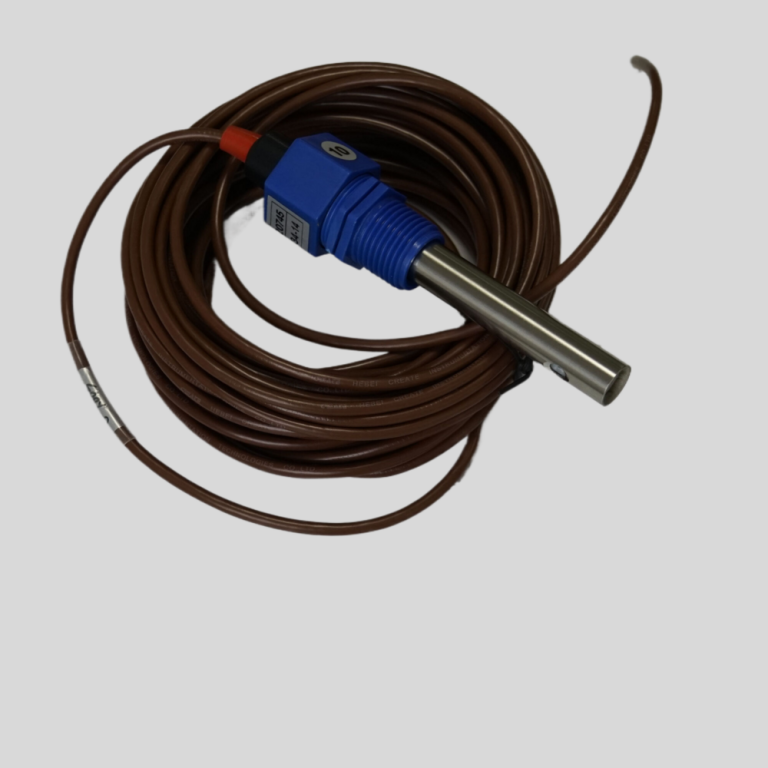
- Shanghai ChiMay’s dissolved oxygen transmitter, in-line pH electrode, and turbine flow meter families are already used in energy-instrumented digester operations across Europe and Asia, feeding the data streams ESG reporting requires.
Why 0.45 kWh/m³ Suddenly Matters at Board Level
For most of the last two decades, wastewater treatment energy intensity was an operating metric that interested plant managers and, occasionally, regulators. Not anymore. Sustainability-linked loans, green bonds, and social bonds now price part of their coupon against measurable, third-party-verifiable environmental KPIs — and energy intensity per unit of treated wastewater is among the most common in the water sector.
The historical benchmark of 0.7 kWh/m³ dates from an era of conservatively run digesters, biogas that was often flared rather than used, and rare sidestream deammonification. The current best-in-class figure near 0.45 kWh/m³ is reached by combining biogas engine deployment, sidestream deammonification of dewatering return liquor, aeration control optimization, and increasingly, waste heat recovery from digestion. Each element is modest on its own; the aggregate moves a utility’s operating margin.
Where the Financing Benefit Comes From
A measured improvement on the energy KPI can translate into real pricing benefit on a sustainability-linked loan. Apply a modest coupon improvement to the debt stack of a mid-size utility and the annual interest saving runs into the hundreds of thousands of dollars; over a ten-year maturity the cumulative saving reaches into the millions — enough to fund a substantial share of the analyzer and heat-recovery investments that achieved the energy target in the first place. Exact figures depend on the debt structure and the covenant terms, so model them from your own balance sheet, but the direction is consistent across the sector.
The lender’s willingness to grant those terms rests on one thing: the utility’s ability to substantiate its energy intensity claim. Which rests on continuous data from the plant’s SCADA and enterprise reporting layer.
What ESG-Focused Lenders Actually Ask For
Sustainability-linked debt documentation typically includes a verification protocol that specifies:
- The instrumentation from which the energy intensity metric is derived.
- The frequency and method of verification against laboratory or reference measurements.
- Third-party assurance provider access to the continuous data stream.
- Escalation clauses if instrumentation is out of service beyond a defined period per calendar year.
Utilities that anchor their energy intensity claim on continuous DO, pH, flow, and gas quality measurement pass these audits without drama. Utilities relying on quarterly grab samples and pump-curve-inferred flow face requests for restated metrics — and in some cases coupon step-ups when the auditor can’t substantiate the reported value.
The Sensor Stack Behind a Defensible Energy Intensity Claim
A defensible sensor stack for reporting sludge and digester energy intensity includes:
- Dissolved oxygen transmitters: measure aeration performance across mainstream and sidestream reactors — aeration is the largest single component of electricity consumption.
- In-line pH electrodes on digester feed and recirculation: confirm the digester holds its optimal window, protecting biogas yield.
- Turbine flow meters on digester recirculation and biogas condensate: feed hydraulic retention time and gas quality reporting.
- Ammonia nitrogen sensors on sidestream reactors: substantiate the aeration savings from partial nitritation-Anammox operation.
- Conductivity analyzers: corroborating signals across the sludge treatment train.
The stack doesn’t need to be exotic or expensive. It needs to be coordinated, well-maintained, and traceable to laboratory verification. That is what converts an operating improvement into a financing benefit.
Board-Level Questions Worth Asking
A CFO or board member reviewing the utility’s sludge and digester operation should ask:
- What is our current energy intensity in kWh/m³ of treated wastewater, and how is it verified?
- Which components of the sludge and digester operation contribute most to the gap between our current intensity and the 0.45 kWh/m³ benchmark?
- What is the instrumentation coverage on those components, and is it enough to substantiate an ESG-linked debt covenant?
- What is the incremental cost of closing the gap, and what interest saving or coupon benefit does it project?
- Which analyzer replacements or additions are needed to bring reporting fidelity to the level our lender’s assurance provider requires?
These questions move sludge and digester operation from a plant-manager topic to a treasurer-and-board topic — which is where the capital allocation actually happens.
The Cost of Under-Investment
Utilities that under-invest in instrumentation may still improve energy intensity through mechanical upgrades, but they typically fail to convert the improvement into financial benefit. Common failure modes:
- Sustainability-linked covenants that step up the coupon because the auditor cannot substantiate the reported metric.
- ESG-focused investors walking away from bond issues where reporting quality is judged inadequate.
- Rate-case regulators questioning energy claims and requiring restated operating metrics.
- Insurance premiums rising as environmental liability underwriters read thin instrumentation coverage as a risk marker.
Every one of these is preventable with a modest, well-planned analyzer stack investment.
What the 0.7 to 0.45 Journey Looks Like
Utilities that have completed the journey to roughly 0.45 kWh/m³ tend to describe the same sequence in board-facing communications: digester heat recovery and biogas engine deployment cut electricity purchases first, sidestream deammonification of dewatering return liquor takes a large bite out of mainstream aeration energy, and continuous DO-based aeration control trims the base load further. The combined effect usually beats the initial forecast, because the measures reinforce each other. Each step required continuous instrumentation — both to control the process reliably and to report the savings credibly to lenders and regulators.
Closing Notes for CFOs and Boards
Energy intensity in the wastewater sector has moved from an operating metric to a financing metric. The distance between 0.7 and 0.45 kWh/m³ is measured in millions of dollars over a decade for any mid-size utility. Boards that put sludge and digester operation on the agenda, question the instrumentation coverage, and connect the operating story to the financing story consistently see the strongest capital allocation outcomes. Shanghai ChiMay’s dissolved oxygen transmitter, in-line pH electrode, ammonia nitrogen sensor, turbine flow meter, and conductivity analyzer families provide the coordinated instrumentation reference stack those boards increasingly expect from their operations teams.