Table of Contents
The Cost of Guessing at Nutrient Strength
Every fertigation system is making a decision about nutrient concentration every time the injection pump runs. In most operations that decision is made from a recipe and a target EC value, checked occasionally with a handheld meter. In between checks, the crop is transpiring, the reservoir is being topped off, and the concentrate is being diluted at a rate that nobody is actually measuring.
The scale of that mismatch is well documented at the global level. FAO’s cropland nutrient balance data puts nitrogen use efficiency worldwide at roughly 45–50%, which means that about half of the nitrogen applied to cropland is not taken up by the crop. Some of it accumulates in soil, some volatilizes, and some leaches into groundwater. The lost fraction is bought at fertilizer prices and then paid for again downstream through nitrate management, monitoring, and in some watersheds regulatory action.
Continuous EC measurement is the least glamorous fix for that problem, and one of the most effective: it converts nutrient strength from an assumption into a measurement that can be controlled.
Why Conductivity Is the Right Proxy
Electrical conductivity measures a solution’s ability to carry current, which tracks the total concentration of dissolved ions. In a fertigation system, that means it captures the combined contribution of every nutrient salt in the mix — nitrate, potassium, calcium, magnesium, sulfate, and the sodium and chloride that arrive with the source water.
That is exactly the property that matters for nutrient management. Conductivity does not tell you the concentration of any individual ion, and it will not distinguish a balanced solution from an imbalanced one with the same total salinity. What it does tell you, continuously and cheaply, is whether the total strength of the solution is where the crop needs it. University of Florida IFAS Extension puts it plainly in its crop guidance: EC is an integrated measure of all ionic species in solution, which makes it the practical tool for monitoring total nutrient strength at the field and greenhouse scale.
Typical targets vary by crop and growth stage:
| Crop Category | Typical EC (mS/cm) | Threshold to Avoid |
|---|---|---|
| Most vegetables | 1.2–2.5 | 3.5–4.0 |
| Leafy greens | 0.8–1.8 | 2.0–2.5 |
| Fruiting crops | 1.5–3.0 | 4.0–5.0 |
| Salt-tolerant species | 2.5–4.5 | 6.0–8.0 |
| Hydroponic seedlings | 0.5–1.0 | 1.5 |
The threshold column is the more important one for a monitoring program. Above it, the crop is spending energy on osmotic adjustment instead of growth, and yield starts to slip before the leaves show anything.
Why EC Drifts in a Fertigation System
An EC reading that moves is normal. What matters is knowing which of the usual causes is responsible:
- Evapotranspiration. Water leaves the root zone, salts stay, so EC in the substrate rises through the day. A rise from morning to afternoon is expected; a rise that does not return to baseline after irrigation is not.
- Top-off dilution. Refilling the tank with raw water drops the EC of the whole volume. Systems that top off without adjusting injection rates run lean for hours.
- Injection faults. A worn fertigation pump, a partially blocked injector, or an air lock in the suction line produces step changes in EC that can persist for a whole cycle.
- Stratification in the reservoir. Unmixed concentrate layers feed the system an inconsistent solution, particularly in tanks that are refilled from the top.
- Carryover between crops. Residual salts in substrate, drippers, and mainlines shift the baseline before the new crop starts.
None of these are visible from a weekly handheld check. A plant under nutrient stress typically shows visible symptoms only days after the underlying event, and by that point the correction is a rescue operation rather than an adjustment.
Inline EC Measurement in the Field
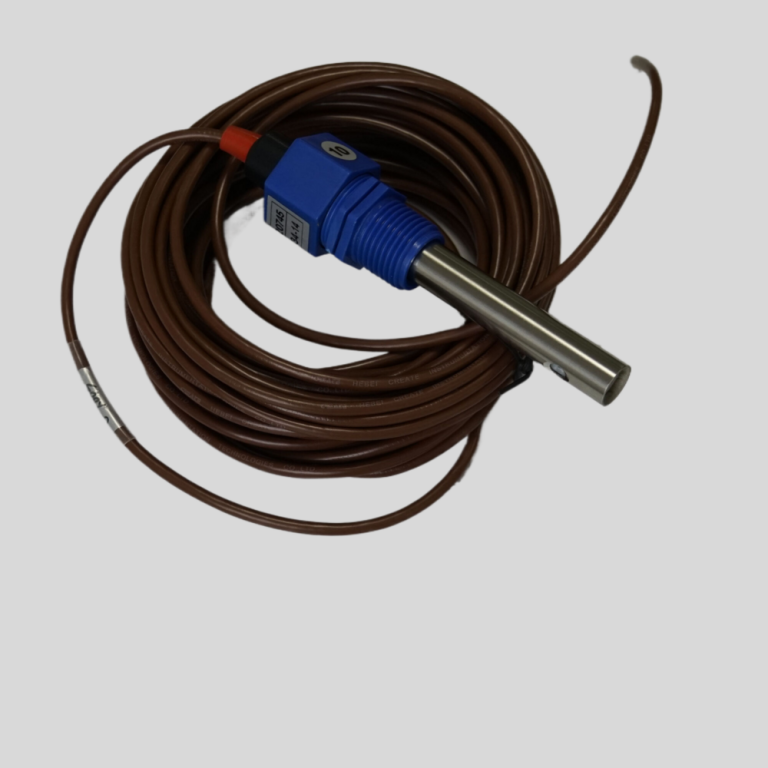
Inline conductivity sensors for fertigation have to survive conditions that laboratory instruments never see: fertilizer solutions that can scale a cell in a season, sunlight, temperature swings, and washdown.
Shanghai ChiMay’s inline conductivity sensors are built for that environment:
- Measurement range: 0–20 mS/cm as standard, expandable to 100 mS/cm for brackish source water
- Accuracy: ±0.5% of reading or ±0.01 mS/cm, whichever is greater
- Temperature compensation: automatic, temperature-coefficient method across 0–70°C
- Cell constant: K=1.0 for general fertigation duty, K=0.1 for low-conductivity water monitoring
- Wetted materials: PVDF housing with stainless steel electrodes
Accuracy in the low percent range matters more than it first appears. In a system targeting 1.8 mS/cm with a control band of ±0.2 mS/cm, an instrument with ±2% error consumes most of the band with measurement uncertainty, and the controller ends up fighting its own noise floor.
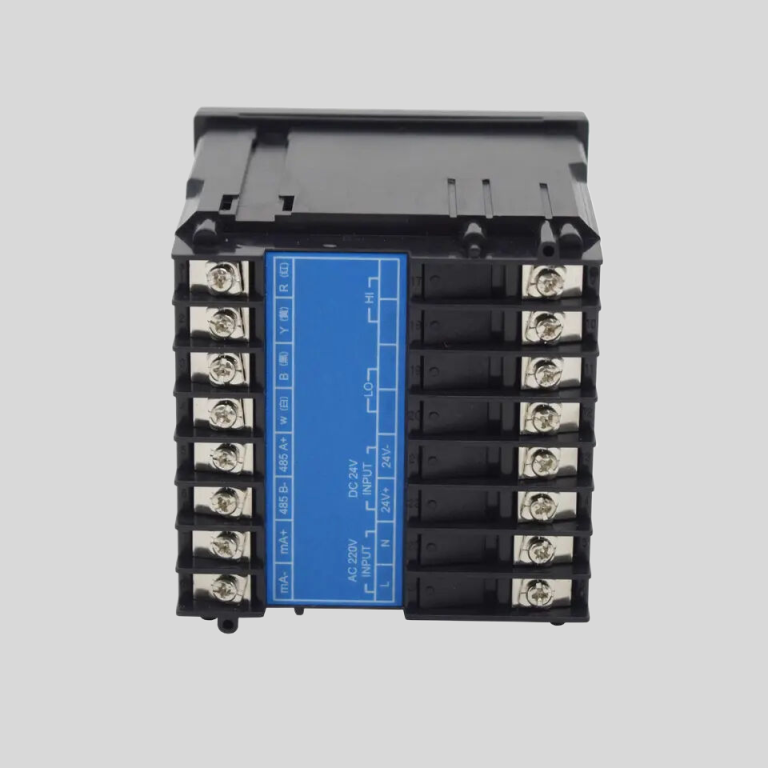
Integration is the other half of the installation. The sensors offer 4–20 mA analog output, Modbus RTU over RS-485 for multi-sensor networks, SDI-12 for solar-powered remote sites, and pulse/frequency output for direct connection to dosing pumps. Shanghai ChiMay supplies pre-configured integration modules for the major irrigation controller families, including Nelson, Rain Bird and Hunter, which removes most of the commissioning work of pairing a sensor with a controller that was designed without one in mind.
What EC Control Actually Delivers
The mechanism behind the savings is not complicated. Conventional fertigation is dosed to a recipe that has to be safe for the worst case in the field — the sandiest block, the shallowest root zone, the hottest week. That means the average block receives more nutrient than it needs on the average day. Continuous EC measurement allows the dose to follow the measurement, so the over-application that a fixed recipe builds in is reduced rather than scheduled.
The results reported for EC-controlled fertigation follow a consistent pattern across published trials and grower experience: applied nutrient falls, nitrogen use efficiency rises, and yield holds or improves slightly because the crop is no longer spending resources on salt stress. The size of the gain depends on how much slack the baseline practice had — a farm already applying split fertigation with soil monitoring will see less than a farm running a single seasonal blend. Fertilizer cost savings tend to fall in the range of tens to a few hundred dollars per hectare for field vegetables and grain crops, and considerably more in greenhouse and nursery operations where the annual nutrient bill per hectare is much larger.
The payback case is usually written on the fertilizer line rather than the yield line. Sensor and controller hardware is a one-time cost; the nutrient savings recur every season, and labor spent on manual nutrient checks falls once the measurements are continuous.
Environmental Compliance Side of the Ledger
Reduced over-application has a second effect that increasingly shows up in farm budgets: less nitrate leaving the field. USGS National Water Quality Assessment data has identified agricultural sources as a leading contributor to nitrate in groundwater across many agricultural regions, and nutrient management is a core part of the regulatory response in those areas.
There is direct financial support for the equipment. USDA’s Environmental Quality Incentives Program (EQIP) cost-shares precision nutrient and irrigation practices, with payment rates that reach 75 percent for qualifying producers. State-level nitrate programs in states with intensive irrigated agriculture add their own requirements on top — in several, documented nutrient management is a condition of operating rather than a voluntary option.
A more indirect benefit is that reduced fertilizer input means reduced emissions from fertilizer manufacture and from soil nitrous oxide, which is where emerging carbon and ecosystem service markets enter the picture. Programs in this space are still developing and pricing varies widely by region and registry, so it is worth checking what is currently accepted locally rather than assuming a value.
Getting Started
The practical sequence for most operations is straightforward:
- Measure the baseline. Install the sensor and log EC for a full crop cycle before changing any dosing logic. Most growers are surprised by how much the current system drifts.
- Set control bands, not setpoints. A target with a tolerance is what the controller can actually hold; a single number is not.
- Connect to the controller. Analog, Modbus or pulse output, whichever matches the existing panel. Automatic dosing adjustment is what turns a measurement into a saving.
- Review weekly. Trend review catches sensor fouling and injector wear long before they become nutrient problems.
Fertilizer is one of the largest variable costs in irrigated production, and it is one of the few where the waste is measurable in real time. EC monitoring is the instrument that makes that waste visible — which is the prerequisite for reducing it.