Municipal water quality monitoring has changed shape over the past decade. Electrochemical probes for pH, dissolved oxygen and conductivity are still the workhorses, but optical instruments have taken over several parameters entirely — turbidity, organics, nitrate, and hydrocarbon detection among them. The appeal is straightforward: no reagents to buy, store and dispose of, and a measurement that can run continuously without a technician standing next to it.
Table of Contents
Understanding Optical Sensing Technology
How UV-Vis Spectroscopy Works
Optical sensors using ultraviolet-visible (UV-vis) spectroscopy measure how much light a sample absorbs at specific wavelengths. Water flows through a cell, the instrument scans the spectrum, and the absorption pattern identifies and quantifies what is dissolved in it. Because different compounds absorb at characteristic wavelengths, one instrument can report several parameters from a single measurement.
This is where optical methods beat electrochemistry. Organic contamination — the fraction that fouls membranes and forms disinfection byproducts — is visible in the UV spectrum, so you get a direct signal instead of inferring it from a surrogate. Petroleum hydrocarbons are among the compounds UV absorbance picks up, typically at low milligram-per-litre concentrations depending on the water matrix and the path length used.
Fluorescence-Based Detection
Induced fluorescence is the other useful technique. Organic matter absorbs UV light and re-emits at longer wavelengths. The emission pattern separates natural organic matter from algal organic matter, from microbial activity, from some industrial pollutants — a distinction that absorbance alone cannot make.
Fluorescence monitoring is particularly good at catching change. When a source water reservoir starts producing algal organic matter, the fluorescence signature shifts before turbidity or DOC moves measurably. Utilities using it for source water surveillance report detecting contamination events that conventional grab sampling missed, though how many events and by what margin depends on the monitoring density and the sampling program being compared against.
Advantages Over Traditional Methods
Reagent-Free Operation
Wet chemistry needs reagents, calibration standards, and a waste stream. Optical instruments need none of that, which removes an ongoing consumable cost and the associated handling risk. In laboratories, reagent purchase and disposal are a meaningful line in the operating budget — which is why reagent-free methods get attention from facilities under pressure to cut chemical use and waste.
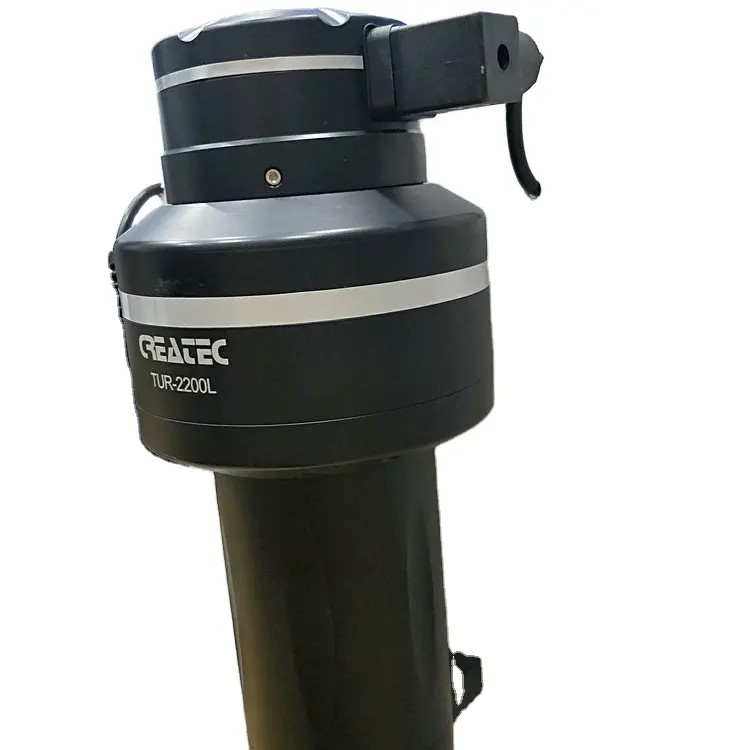
Shanghai ChiMay’s inline optical sensors are built for municipal service, with automatic wavelength referencing and continuous self-diagnostics so the instrument tells you when it needs attention rather than drifting quietly.
Real-Time Multi-Parameter Analysis
One installation can cover turbidity, dissolved organic carbon, nitrate and hydrocarbon contamination simultaneously. That consolidation reduces the number of instrument locations and the cabling and panels behind them, and it means the parameters are measured on the same water at the same moment — which matters when you are trying to work out whether a nitrate rise is a real event or a sampling artefact.
Faster Response Times
Optical instruments read every 30 seconds or so, against the 15–30 minutes of a laboratory method. For a contamination event travelling down a main, that difference decides whether you can isolate a zone before it reaches customers. The operational benefit of a dense real-time network is fewer people exposed to contaminated water — the magnitude depends on the network coverage and how fast the utility’s response protocol runs.
Implementation Considerations
Deployment Scenarios
Optical sensors fit at the points where decisions get made:
- Source water intake — early detection of algal blooms and organic pollution
- Treatment plant effluent — verification that the process is doing what it claims
- Distribution checkpoints — tracking quality through the network
- Storage reservoirs — stratification, turnover and biofilm development
Integration with SCADA Systems
Modern optical instruments communicate over Modbus TCP/IP and HART, which means they drop into existing SCADA without a custom gateway. Configure alarms on the parameters that actually indicate a problem, and route them to whoever is on shift.
Maintenance Requirements
Reagent-free is not maintenance-free:
- Calibration: annual verification against certified standards for most installations
- Optical surfaces: monthly inspection; wiping frequency depends on the water
- Flow cell: quarterly check of alignment and cleanliness
AWWA’s guidance is to align calibration intervals with the manufacturer’s specification and with the measurement uncertainty your permit requires. A ±2% uncertainty target is achievable for turbidity and absorbance parameters when the cell is clean — which is why keeping the optics clean is the maintenance task that matters most.
Industry Standards and Compliance
Regulatory Framework
The Safe Drinking Water Act requires continuous turbidity monitoring at filtered surface water plants, and optical instruments are the standard technology for meeting that requirement. The revised EU Drinking Water Directive 2020/2184 tightens monitoring and treatment requirements across member states, and national rules generally accept alternative measurement methods provided they demonstrate equivalent performance against a reference method. That is the practical route by which optical instruments are approved for compliance use — method equivalence, documented and validated, rather than a named technology in the directive text.
Performance Verification
ISO 7027 governs turbidity measurement — nephelometric detection at 90°, an 860 nm infrared source and formazin-traceable calibration. Nephelometric optical sensors that comply with it produce data comparable across monitoring networks, which matters when results are shared between utilities or used in regulatory reporting.
Future Developments
Miniaturization and Cost Reduction
Semiconductor advances keep pushing instrument cost down, and a smaller spectrometer means a smaller, cheaper analyser. Prices for optical monitoring have been falling steadily as the volume of deployed sensors grows, which brings distributed networks within reach of smaller municipalities that could not justify them a decade ago.
Machine Learning Integration
Optical data is well suited to pattern recognition. Absorbance and fluorescence spectra carry more information than the handful of parameters an instrument reports directly, and models trained on historical events can flag the pattern that preceded a contamination incident. Advance warning in the hours range is achievable for events with a clear spectral signature, such as a hydrocarbon slug or an algal bloom onset. Events without one — a slow ingress of an inorganic contaminant, for example — will not be caught this way.
Remote Monitoring Networks
LoRaWAN and NB-IoT let utilities deploy sensors at points where no power or data cable exists. Coverage of several kilometres from a gateway is realistic in urban terrain, and the low-power profile means battery life measured in years rather than months. That removes the wiring cost that made distributed monitoring expensive, although signal penetration in basements, valve chambers and dense industrial areas still needs testing on site before you commit to a layout.
Where Optical Monitoring Is Heading
Optical instruments now cover the parameters that were hardest to measure continuously a decade ago, and they do it without reagents. The instruments are also converging on a common data layer — Modbus and HART out of the box, SCADA integration as a standard deliverable rather than a project.
For municipalities, the practical next step is coverage. A handful of well-placed optical sensors at intake, plant effluent and the problem areas of the distribution network will tell you more about system behaviour than a denser deployment of parameters you already measure by hand. Shanghai ChiMay’s optical sensor range is built to slot into that kind of layout, with the calibration and diagnostic functions that keep a distributed network maintainable.