Table of Contents
Introduction
Zero liquid discharge (ZLD) procurement has a predictable failure mode: capital cost dominates the conversation while the operating costs that will run for fifteen years get a footnote. This is how facilities end up with the cheapest bid and the most expensive system.
Operating costs—energy above all, since evaporation and crystallization are energy-hungry by nature—typically account for the majority of lifecycle cost in a ZLD plant, on the order of two-thirds or more over a 15-year horizon. Procurement teams that evaluate total cost of ownership (TCO) rather than capital price consistently end up with lower lifecycle costs; the size of the advantage depends on the duty, but for plants in the several-million-dollar capital range the spread between bids is routinely enough to pay for the analysis many times over.
This guide provides the analytical framework for TCO evaluation of ZLD system vendors.
Understanding ZLD Cost Structure
Lifecycle Cost Components
ZLD system costs accumulate across three phases:
Capital investment phase:
- Equipment procurement
- Engineering and design
- Installation and commissioning
- Initial operator training
- Start-up spare parts inventory
Operating phase (years 1-15):
- Energy consumption
- Chemical consumption
- Labor for operation and monitoring
- Routine maintenance
- Membrane and consumable replacement
- Monitoring and analysis costs
- Insurance and permits
End-of-life phase:
- Decommissioning
- Equipment disposal
- Site restoration
Cost Distribution Analysis
The distribution below reflects typical estimates for a mid-size ZLD installation. Exact numbers shift with energy prices and feed water chemistry, but the shape is consistent: operations dominate.
| Cost Category | Percentage | Typical Value ($5M Installation) |
|---|---|---|
| Capital cost | 15-25% | $750,000-1,250,000 |
| Energy | 35-45% | $1,750,000-2,250,000 |
| Membrane replacement | 10-15% | $500,000-750,000 |
| Chemicals | 8-12% | $400,000-600,000 |
| Labor | 10-15% | $500,000-750,000 |
| Maintenance | 5-10% | $250,000-500,000 |
| Other operating | 3-5% | $150,000-250,000 |
| Total operating (15 years) | 65-75% | $3,250,000-4,250,000 |
This is why operating cost optimization deserves more attention in vendor evaluation than it usually gets.
TCO Analytical Framework
Direct Operating Costs
Energy consumption:
- Measure in kWh per cubic meter treated
- Compare across proposals at identical operating conditions
- Consider partial-load efficiency for variable production facilities
- Calculate annual energy cost: Volume × kWh/m³ × $/kWh
Membrane replacement:
- Membrane lifespan (typical: 3-7 years depending on application)
- Replacement cost per element
- Number of elements requiring replacement
- Availability and pricing stability commitments
Chemical consumption:
- Antiscalants for membrane protection
- Acids and bases for pH adjustment
- Cleaning chemicals for membrane maintenance
- Compare dosages and pricing at specified conditions
Labor requirements:
- Operator hours per shift
- Skill level requirements (technician vs. operator)
- Supervision and management needs
- Training investment for system-specific skills
Indirect Operating Costs
Monitoring and analysis:
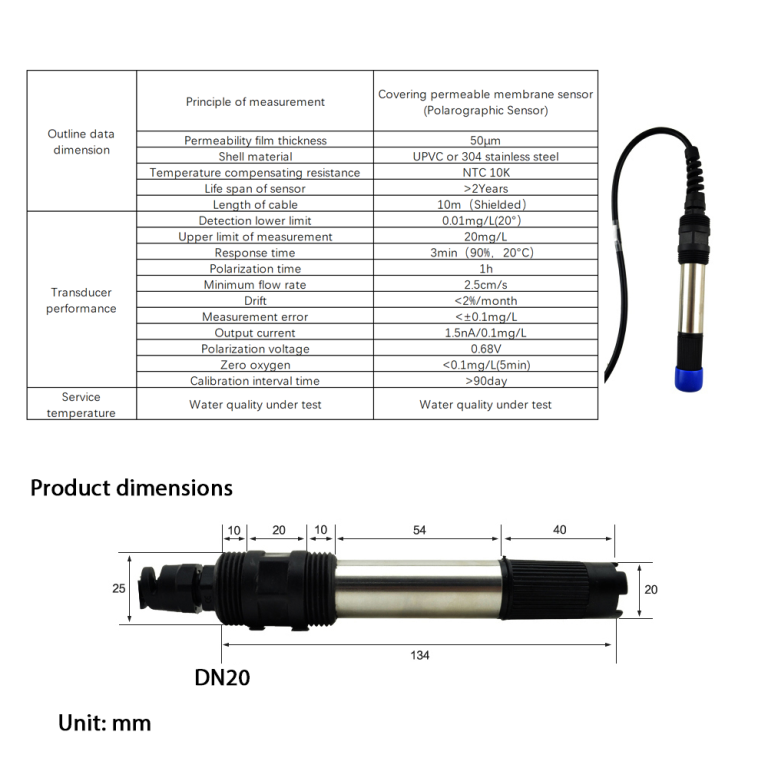
- Water quality monitoring instrumentation
- Laboratory analysis requirements
- Calibration and maintenance of sensors
- Data management and reporting
Maintenance and repairs:
- Preventive maintenance requirements
- Spare parts inventory
- Contractor support costs
- Unplanned maintenance contingency
Compliance costs:
- Permit fees and regulatory reporting
- Monitoring equipment for compliance verification
- Consultant support for regulatory compliance
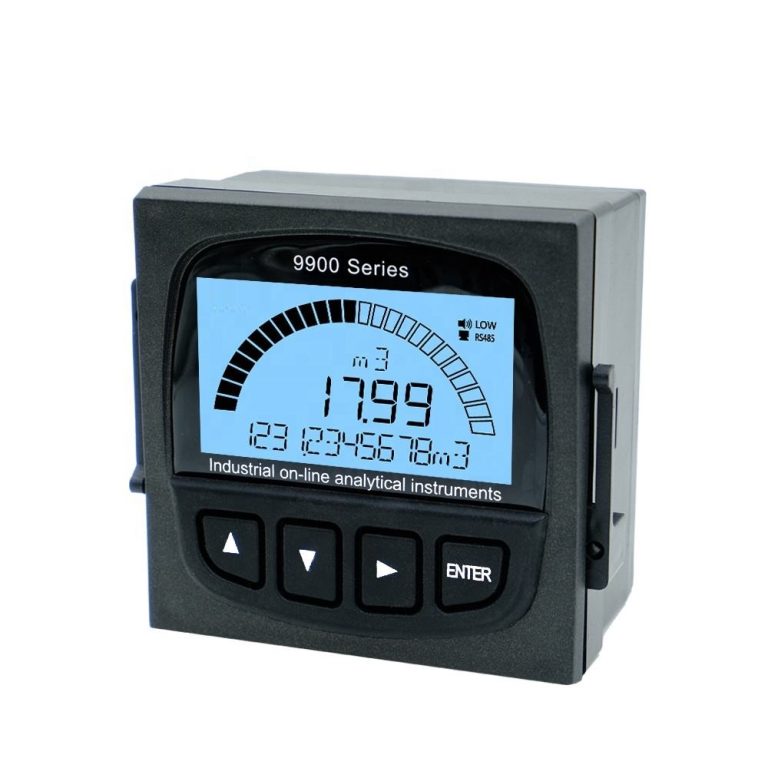
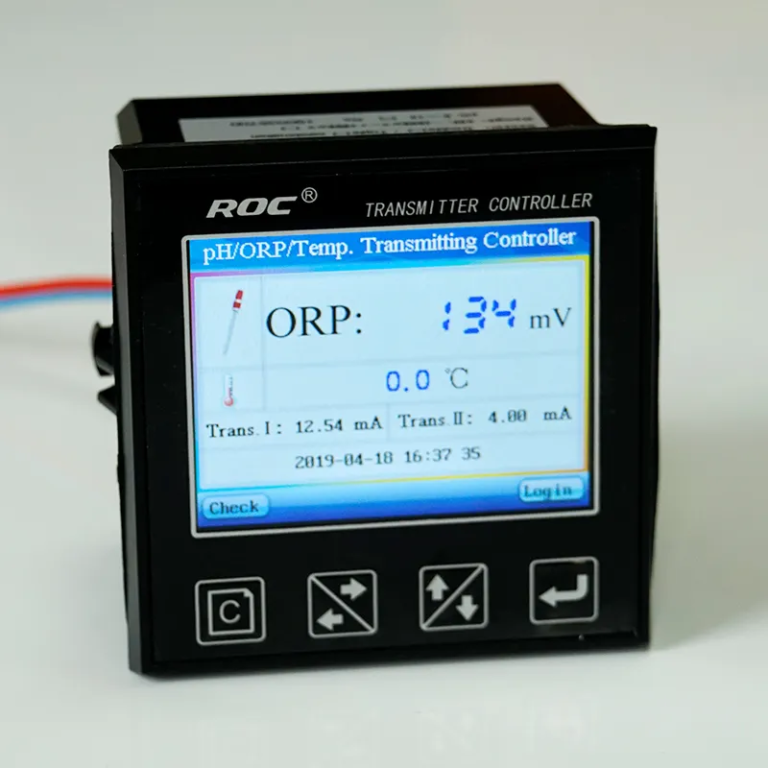
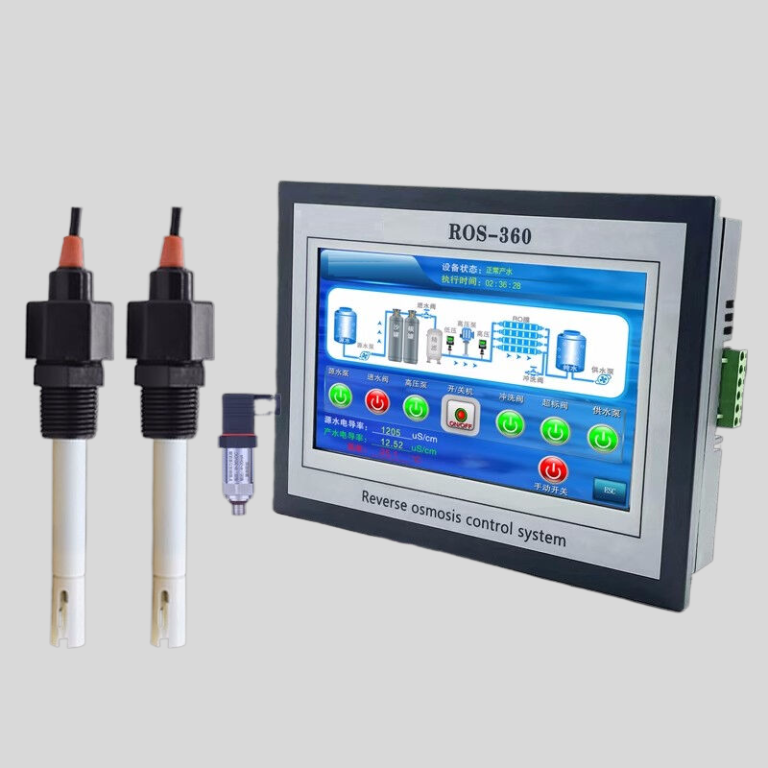
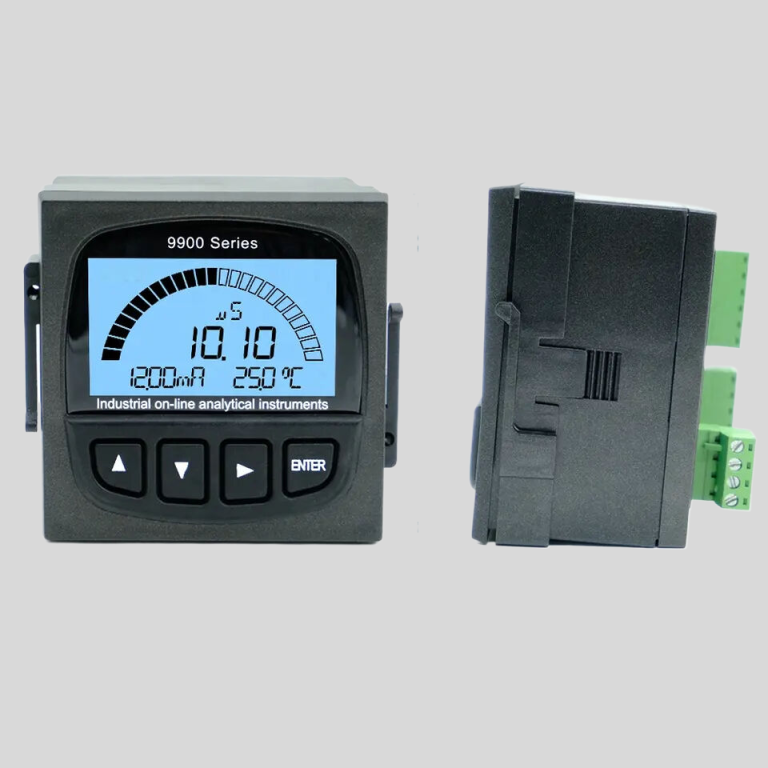
Shanghai ChiMay provides monitoring solutions that cover the indirect operating cost categories—instrumentation, calibration, data management—while supporting compliance verification.
Risk-Related Costs
Performance shortfall costs:
- Production losses from inadequate treatment
- Product quality impacts from process variability
- Compliance violations and penalties
Downtime costs:
- Lost production during equipment failures
- Emergency maintenance response costs
- Customer impacts and reputational damage
Technology obsolescence:
- Ability to upgrade or expand system
- Compatibility with evolving regulations
- Access to improved technologies
Vendor Comparison Methodology
Developing Comparison Baselines
Effective comparison requires standardized assumptions:
Operating conditions:
- Feed water characteristics (all proposals evaluate identical feed)
- Production rate and recovery targets
- Operating hours per year
- Utility pricing (electricity, water, chemical)
Financial parameters:
- Discount rate for NPV calculation (typically 8-12%)
- Project life for lifecycle analysis (typically 15-20 years)
- Inflation assumptions for operating cost escalation
- Tax and depreciation treatment
Scope definition:
- Clear delineation of included and excluded equipment
- Installation and commissioning responsibilities
- Training and documentation provisions
- Warranty coverage and duration
Scoring and Weighting
| TCO Component | Typical Weight | Justification |
|---|---|---|
| Capital cost | 15% | One-time, relatively small portion |
| Energy cost | 30% | Largest ongoing expense |
| Membrane/chemical cost | 20% | Significant consumables |
| Maintenance cost | 15% | Ongoing requirement |
| Monitoring cost | 10% | Enables optimization |
| Risk factor | 10% | Insurance value of reliability |
Case Study: TCO Comparison
The scenario below is illustrative rather than a record of a specific project, but the pattern it shows comes up constantly:
Project scenario:
- 2,000 m³/day ZLD system
- Feed: Industrial wastewater, 5,000 μS/cm conductivity
- Recovery target: 85%
- Operating hours: 8,000 hours/year
- Project life: 15 years
- Energy cost: $0.10/kWh
Vendor comparison:
| Vendor | Capital | Annual Energy | Annual M&C | 15-yr NPV | Rank |
|---|---|---|---|---|---|
| Vendor A | $4.2M | $180,000 | $120,000 | $7.8M | 1 |
| Vendor B | $3.8M | $220,000 | $145,000 | $8.2M | 2 |
| Vendor C | $3.5M | $250,000 | $160,000 | $8.7M | 3 |
Vendor C presented the lowest capital cost—$700,000 less than Vendor A—yet the 15-year lifecycle cost is $900,000 higher. TCO analysis reveals the true economic comparison.
Performance Guarantee Evaluation
Guarantee Structure
Vendor performance guarantees should address:
Treatment performance:
- Permeate quality specifications
- Recovery rate requirements
- Concentration capability for concentrate stream
Operational performance:
- Minimum production rate
- Maximum energy consumption
- Cleaning frequency limits
Reliability metrics:
- Guaranteed uptime percentage
- Maximum unplanned downtime hours
- Mean time between failures (MTBF)
Guarantee Terms
Commercial terms for performance guarantees:
Duration:
- Standard warranty: 1-2 years
- Performance guarantee: 3-5 years preferred
- Extended guarantees: negotiable with pricing adjustments
Measurement methodology:
- Clear definition of performance parameters
- Measurement points and equipment specifications
- Data collection and reporting protocols
- Dispute resolution procedures
Remediation provisions:
- Liquidated damages for performance shortfalls
- Performance bond or escrow arrangements
- Termination rights for persistent underperformance
Shanghai ChiMay supports performance guarantee evaluation with monitoring systems that make performance verification objective and transparent.
Long-Term Partnership Considerations
Vendor Financial Stability
Evaluating vendor financial health protects long-term interests:
Financial metrics:
- Revenue and profitability trends
- Debt levels and credit ratings
- Cash flow adequacy
- Market position and growth
Strategic considerations:
- Market consolidation trends
- Technology roadmap alignment
- Long-term commitment to market
Service and Support Infrastructure
Long-term operating success depends on vendor support:
Local support presence:
- Service engineers within reasonable response distance
- Spare parts inventory at or near facility
- 24/7 emergency support availability
Technical capability:
- Application engineering resources
- Process optimization expertise
- Training and development programs
Spare parts pricing:
- Initial pricing lock-in periods
- Long-term pricing mechanisms
- Price escalation formulas
Technology Evolution
ZLD technology continues advancing:
Upgrade pathways:
- Compatibility of new membrane generations
- Control system evolution and compatibility
- Energy recovery improvements
Vendor innovation:
- Research and development investment
- New product development pipeline
- Industry leadership and standards influence
Negotiation Strategies
Capital Cost Negotiation
Operating costs dominate TCO, but capital negotiation still matters:
- Volume commitments: multiple system procurement or long-term agreements
- Payment terms: timing optimization for cash flow management
- Performance bonds: negotiate release conditions and duration
- Installation risk: define responsibility allocation clearly
Operating Cost Negotiation
Operating cost provisions deserve equal attention:
Energy efficiency guarantees:
- Maximum kWh/m³ specifications with financial consequences
- Shared savings arrangements for exceeding guarantees
Membrane lifespan guarantees:
- Minimum membrane life requirements
- Pricing commitments for replacement membranes
- Technology refresh provisions
Service level agreements:
- Response time guarantees with penalties
- Preventive maintenance programs
- Spare parts pricing commitments
Implementation Checklist
Pre-Procurement
- [ ] Define operating conditions and performance requirements
- [ ] Establish TCO calculation methodology and assumptions
- [ ] Identify qualified vendors with ZLD experience
- [ ] Develop comprehensive RFP incorporating TCO requirements
Evaluation Phase
- [ ] Request detailed cost breakdowns by category
- [ ] Validate energy and consumable estimates
- [ ] Verify reference installations and performance data
- [ ] Assess vendor financial stability and long-term viability
- [ ] Evaluate service and support capabilities
Negotiation Phase
- [ ] Negotiate performance guarantees with financial consequences
- [ ] Secure operating cost commitments (energy, membranes, chemicals)
- [ ] Establish service level agreements with penalties
- [ ] Lock in spare parts pricing for extended periods
- [ ] Define upgrade pathways and technology evolution provisions
Post-Selection
- [ ] Implement monitoring systems for performance verification
- [ ] Establish regular performance review cadence
- [ ] Document lessons learned for future procurement
- [ ] Maintain relationship management engagement
Conclusion
TCO analysis turns ZLD vendor evaluation from a capital purchase into a lifecycle investment decision. Facilities that do it rigorously get lower lifecycle costs, better vendor relationships, less risk exposure, and better operating economics out of the same procurement budget.
Shanghai ChiMay supports TCO-based evaluation with monitoring systems that enable objective performance measurement, application engineering support for ZLD optimization, and service infrastructure for the long haul. The analysis takes real effort up front. For most ZLD projects, it is the highest-return engineering work done during procurement.