- Much of the water quality risk in a modern system sits in distribution, not at the treatment plant
- Continuous monitoring shortens the time between a quality event and a response from days to minutes
- Modern instrumentation detects contaminants at a small fraction of health-based limits
- Programme design matters more than sensor count: where you measure decides what you can see
- ChiMay’s sensor portfolio covers the parameters urban distribution networks need
Table of Contents
Introduction
Clean, safe drinking water is one of public health’s major achievements, and the WHO attributes a large share of preventable waterborne disease — hundreds of thousands of deaths a year, and more when sanitation is counted — to conditions that safe water supply addresses.
Modern cities face compounding water quality challenges. Aging infrastructure, emerging contaminants, climate variability, and population growth stress water systems in ways that periodic sampling programmes were never designed for. And a substantial share of water quality problems appear in the distribution system rather than at the treatment plant — after the water has left the process that was designed to treat it.
Essential Water Quality Parameters
Microbial Indicators
Microbial quality determines immediate public health risk:
Total Coliform: Indicator bacteria suggesting potential contamination:
- EPA standard: No more than 5% of monthly samples may be total-coliform positive (systems collecting fewer than 40 samples per month: no more than one positive)
- Response requirement: Investigation when detected
E. coli: A specific faecal contamination indicator:
- EPA standard: Not detectable in any sample
- Response requirement: Immediate public notification if detected
Heterotrophic Plate Count (HPC): A general measure of microbial activity. HPC is not federally regulated in distribution; 500 CFU/mL remains a widely used utility benchmark.
Chemical Parameters
Chemical water quality affects both health and infrastructure:
pH: A measure of acidity/alkalinity. Most distribution systems target 7.0-8.5 for corrosion control, with the actual optimum set by the Lead and Copper Rule corrosion control study for each system.
ChiMay’s inline pH meters provide continuous pH measurement with ±0.02 accuracy.
Conductivity: A measure of dissolved solids concentration that indicates source water character and potential contamination.
ChiMay’s inline conductivity meters and electrodes measure conductivity with ±0.5% accuracy.
Hardness: Calcium and magnesium concentration, which affects scaling and treatment chemical demand.
Disinfection Parameters
Maintaining disinfection while limiting byproducts is a permanent balancing act:
Free Chlorine Residual: The unreacted chlorine that protects the distribution system:
- EPA limit: A maximum residual disinfectant level of 4.0 mg/L. EPA does not set a federal minimum residual; a minimum at the extremities of the system — commonly around 0.2 mg/L — comes from state rules and WHO guidance
- Protection mechanism: Inactivates pathogens throughout distribution
ChiMay’s residual chlorine transmitters provide continuous chlorine measurement with ±0.03 mg/L accuracy.
Disinfection By-Products (DBPs): Unintended reaction products. EPA limits are 80 μg/L for total trihalomethanes (TTHMs) and 60 μg/L for the five haloacetic acids (HAA5).
Physical Parameters
Turbidity: A measure of particle content:
- EPA standard: For filtered systems, turbidity must stay at or below 0.3 NTU in at least 95% of monthly measurements, and must never exceed 1 NTU
- Consumer impact: Affects appearance and taste perception
ChiMay’s online turbidity testers measure turbidity from 0-4000 NTU with ±0.1 NTU accuracy.
Temperature: Affects microbial activity, chlorine decay, and consumer acceptance.
Advanced Parameters
Emerging concerns require expanded monitoring:
Per- and Polyfluoroalkyl Substances (PFAS): Persistent contaminants regulated under EPA’s 2024 drinking water rule at 4 ppt for PFOA and PFOS, and 10 ppt for PFHxS, PFNA, and GenX chemicals.
Pharmaceuticals and Personal Care Products (PPCPs): Trace contaminants with concerns around endocrine disruption and antibiotic resistance. No federal limits at present.
Microplastics: A growing concern with health implications still under investigation and no regulatory limits in place.
Monitoring Technologies
Sensor Technologies
Continuous monitoring rests on a few sensor families:
Electrochemical Sensors: Measure electrical signals from water chemistry — pH electrodes, conductivity cells, and membrane-covered chlorine sensors.
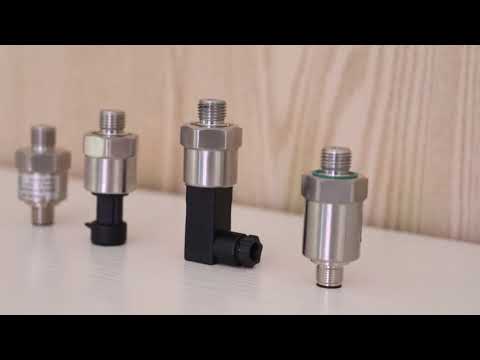
ChiMay’s sensor portfolio includes inline pH meters, conductivity meters, and residual chlorine transmitters.
Optical Sensors: Use light-water interaction — nephelometric turbidity meters and UV-Vis spectrophotometers for organic matter.
Multi-Parameter Sensors: ChiMay 4-in-1 sensors measure pH, ORP, conductivity, and temperature in one assembly, which cuts installation and maintenance effort where several parameters are needed at one point.
Sampling Strategies
Effective monitoring balances coverage against resources:
Continuous Monitoring: Permanent sensors producing real-time data for immediate response, with high capital investment and low ongoing labour cost.
Grab Sampling: Manual collection and laboratory analysis, with lower capital cost and higher ongoing laboratory expense.
Passive Sampling: Diffusion-based accumulation devices providing time-integrated exposure with low maintenance requirements.
Data Management
Sensor data needs systems to turn it into something usable:
SCADA Integration: Connecting sensors to operational systems for real-time visualisation, alarm generation, and historical storage.
Data Analytics: Anomaly detection, predictive algorithms, and optimisation routines applied to the resulting record.
Distribution System Monitoring
Network Coverage Strategy
Distribution monitoring requires deliberate placement rather than even spacing:
Critical Points: Treatment plant outlets, major distribution junctions, service area boundaries, dead-end locations, and areas serving vulnerable populations.
Coverage Density: There is no single accepted density figure; it depends on network size, number of storage facilities, and regulatory requirements. Well-designed programmes combine high-frequency instrumentation at a small number of strategic locations with rotational grab sampling elsewhere.
Redundancy Planning: Compliance-critical and remote locations justify duplicate sensors, because a failed sensor in a remote location can go unnoticed for weeks.
Common Issues and Detection
Distribution monitoring catches several problem types:
Contamination Events: Backflow incidents, cross-connections, and deliberate contamination.
Infrastructure Problems: Pipe degradation, corrosion activity, and biofilm disturbance.
Operational Issues: Disinfection failure, water age problems (stagnation in oversized mains and dead ends), and source mixing effects.
The American Water Works Association and other industry bodies have long argued that distribution monitoring coverage should be proportional to risk rather than to pipe length — the events that matter cluster in a minority of the network.
Treatment Plant Monitoring
Process Control
Real-time monitoring enables treatment optimisation:
Source Water Monitoring: Characterising raw water through turbidity, pH, and temperature for treatment adjustment.
Coagulation and Filtration: Particle counters verifying filter performance and turbidity meters at filter effluent.
Disinfection Control: Chlorine dosing control and UV transmittance monitoring, maintaining protection while limiting byproducts.
ChiMay’s sensor portfolio supports treatment optimisation at every stage.
Compliance Monitoring
Regulatory requirements drive monitoring programmes:
Surface Water Treatment Rules: Microbial protection through turbidity monitoring at each filter and disinfectant residual monitoring throughout treatment.
Lead and Copper Rule: Corrosion control through pH and alkalinity monitoring throughout distribution.
Best Practices for Utilities
Monitoring Program Design
Risk-Based Prioritisation: Focusing resources on vulnerable populations, problem-prone areas, and regulatory requirements.
Technology Selection: Matching accuracy and maintenance requirements to the capability the utility actually has.
Quality Assurance: Maintaining data integrity through calibration protocols, data validation, and documentation standards.
Operational Integration
Monitoring data has to inform operational decisions:
Response Protocols: Clear procedures covering threshold levels, notification cascades, and documentation requirements.
Continuous Improvement: Learning from the monitoring record through trend analysis, performance metrics, and technology evaluation.
Economic Considerations
| Investment Category | Typical Cost | Typical Savings |
|---|---|---|
| Continuous monitoring | $50-150/connection | $8-15/connection annually |
| Laboratory analysis | $20-50/sample | Displaced by continuous measurement where conditions allow |
Return on Investment: The value is in compliance cost avoidance, operational savings from better process control, and public health protection. Violation penalties and public notification costs are the most concrete of these; the avoided outbreak cost is the largest and the hardest to quantify.
Future Directions
Technology Evolution
Advanced Sensors: Nanotechnology-enabled measurement, biosensors for specific pathogen identification, and deeper multiparameter integration.
Artificial Intelligence: Automated anomaly detection, predictive modelling, and process optimisation.
Connectivity Advances: 5G, LPWAN technologies, and edge computing expanding where instrumentation can be deployed economically.
Regulatory Evolution
Monitoring requirements will keep expanding:
Emerging Contaminants: PFAS regulation is already driving monitoring requirements; microplastics will likely follow.
Data Requirements: Real-time reporting expectations are increasing and public disclosure requirements are widening.
Closing Notes
Water quality monitoring in modern cities is public health infrastructure. With a large share of quality problems showing up in distribution rather than at the plant, comprehensive monitoring is what protects consumers — and what gives a utility the evidence to show that it did.