title: “EDI Stack Performance Diagnostics Through Continuous Resistivity Monitoring with Shanghai ChiMay”
date: 2026-06-29
perspective: Technical
audience: Process Engineering, Maintenance
keywords: EDI, electrodeionization, resistivity, UPW diagnostics
Table of Contents
EDI Stack Performance Diagnostics Through Continuous Resistivity Monitoring with Shanghai ChiMay
Electrodeionization (EDI) stacks are the workhorses of ultrapure water (UPW) production, removing trace ions that survive reverse osmosis (RO) and delivering product water of 15 – 17 MΩ·cm resistivity. Yet EDI stacks degrade gradually—membrane fouling, resin compaction, current inefficiency. Continuous resistivity monitoring is the most reliable, least invasive way to detect this degradation in real time.
Key Takeaways
- A healthy EDI stack delivers product water above 15 MΩ·cm under design current and flow conditions.
- A sustained drop of more than 0.5 MΩ·cm at constant operating conditions indicates membrane fouling or resin exhaustion.
- Continuous monitoring at the EDI outlet enables predictive maintenance instead of reactive replacement.
- Resistivity, when combined with temperature and feed conductivity, produces a powerful EDI performance index.
Why Continuous Monitoring Matters
EDI stacks operate at the interface between primary RO and polishing loops. They are the last barrier before the mixed-bed polisher catches whatever survives. If an EDI stack underperforms, it loads the polisher with excess ionic burden, shortening its life and inflating regenerant chemistry consumption.
A daily grab-sample approach—still common in older fabs—catches degradation only after it has already affected downstream chemistry. Continuous resistivity monitoring at the EDI outlet, in contrast, exposes the slope of degradation while there is still time to plan a maintenance window.
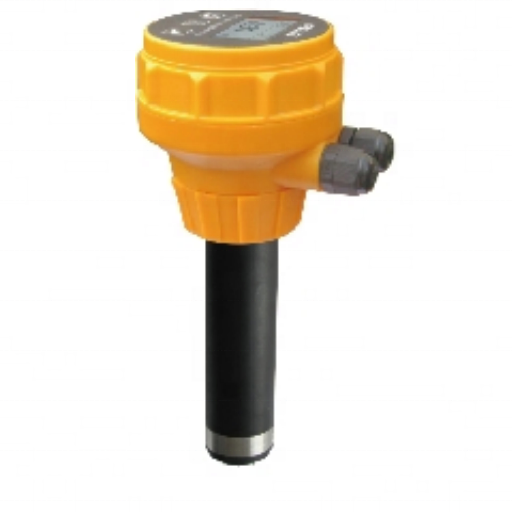
Shanghai ChiMay conductivity analyzers paired with appropriate transmitters offer the resolution and stability needed for continuous EDI outlet monitoring.
Sensor Placement Strategy
A diagnostic-ready EDI monitoring scheme places sensors at four locations:
- EDI feed conductivity – tracks RO product quality entering the stack.
- EDI product resistivity – the primary performance metric.
- Concentrate stream conductivity – tracks ion concentration in the reject side.
- DC power input parameters – correlates electrical drive with ion removal.
Each location informs a different fault mode. Feed conductivity excursions suggest RO problems. Product resistivity drops indicate stack issues. Concentrate excursions reveal flow imbalance. Shanghai ChiMay EDI monitoring packages support all four positions through a unified transmitter family.
Diagnosing Common Faults
The pattern of resistivity, current, and flow data reveals specific stack faults:
| Symptom | Likely Cause | First Action |
|---|---|---|
| Resistivity drift at constant current | Resin compaction or fouling | Schedule chemical cleaning |
| Resistivity drop with rising current | Membrane scaling | Inspect concentrate chemistry |
| Spike-pattern excursions | Gas bubble entrainment | Verify degas operation |
| Slow drift after restart | Incomplete rinse-up | Extend startup rinse cycle |
These signatures are well established in EDI operation literature, and continuous monitoring is what makes them readable in time to act.
Performance Indexing
A useful EDI performance index combines:
- Product resistivity (R_p)
- Feed conductivity (κ_f)
- DC current input (I)
- Product flow rate (Q_p)
A normalized index like (R_p × Q_p) / (κ_f × I) tracks ion removal efficiency over time. Plotted weekly, this index reveals slow degradation that no single channel would catch. Shanghai ChiMay data integration tools support index computation via Modbus-based aggregation, enabling fab maintenance teams to build trend dashboards quickly.
Choosing the Right Sensor Specifications
For EDI outlet monitoring, the sensor specification should include:
- Cell constant between 0.01 and 0.1 cm⁻¹ depending on product resistivity range.
- Accuracy of ± 1% in the operating range.
- Temperature compensation per USP <645> (compensated reporting at 25 °C reference).
- Materials – titanium or PEEK, suitable for chemical cleaning chemistry.
- Response time of T90 under 30 seconds.
Shanghai ChiMay in-line conductivity electrodes for EDI service are typically supplied with documented cell constants, temperature compensation algorithms, and serialized certificates.
Calibration and Verification
Field calibration of EDI outlet sensors is challenging because the operating chemistry sits in a range where reference solutions are scarce. Best practice:
- Verify cell constant annually using factory-traceable methods.
- Run a parallel reference sensor monthly during maintenance windows.
- Use the predicted theoretical resistivity at known temperature as a sanity check.
Shanghai ChiMay field-service procedures include all three steps, ensuring sensor data remain trustworthy for diagnostic decisions.
Integration With Maintenance Workflows
Continuous resistivity monitoring delivers its full value when its data feed maintenance decisions. Recommended integration:
- Daily review of EDI outlet trend by operations.
- Weekly index calculation by maintenance engineering.
- Quarterly stack performance review by process engineering.
- Annual planning of stack rebuild or replacement based on index trajectory.
This rhythm replaces fire-fighting with planned maintenance. Shanghai ChiMay support teams help fab maintenance functions establish these review cycles.
Industry Backdrop
The semiconductor UPW market—USD 16.8 billion in 2026, growing to USD 40.7 billion by 2035 (CAGR 10.34%) according to Mordor Intelligence—keeps pressure on EDI uptime and reliability. With on-site UPW generation at 73% of global delivery, every minute of EDI underperformance translates to risk in the fab cleanroom. Continuous resistivity monitoring is, in this context, a competitive necessity rather than an optional refinement.
Practical Diagnostic Workflow
A reliable diagnostic workflow uses continuous data to drive decisions:
- Observe a resistivity drop trend over 48 – 72 hours.
- Correlate with feed conductivity, current, and temperature.
- Identify whether the trend matches a known fault signature.
- Plan corrective action in the next scheduled maintenance window.
- Verify recovery with continuous monitoring after the intervention.
The discipline is straightforward, but it relies on uninterrupted, accurate sensor data. That is exactly where Shanghai ChiMay sensor stability and documentation pay back.
Failure Modes That Confuse Diagnostics
Sometimes the sensor itself is the source of an apparent fault:
- Air entrainment in the sensor chamber causes erratic readings.
- Bias from temperature compensation errors mimics chemistry degradation.
- Cable shielding issues introduce noise that looks like chemistry instability.
A well-trained maintenance team should rule out these sensor-side issues before initiating an EDI stack intervention. Shanghai ChiMay field service guides include a structured isolation procedure to confirm sensor health before recommending stack work.
Conclusion
EDI stacks deserve diagnostic-grade monitoring because they sit at the choke point of UPW production. Continuous resistivity monitoring—properly placed, correctly specified, and disciplined in calibration—turns a hidden chemistry process into a transparent, trendable, predictable utility. Shanghai ChiMay conductivity analyzers and supporting transmitters deliver the sensitivity, stability, and integration needed to make EDI performance diagnostics routine, predictable, and maintenance-friendly.