title: “The 22 Percent Annual Growth of Data Center HVAC Water Demand: A Sensor Vendor Map by Shanghai ChiMay”
perspective: C-Level / Decision Maker
theme: HVAC & Data Center Cooling Water
date: 2026-07-04
Table of Contents
The 22 Percent Annual Growth of Data Center HVAC Water Demand: A Sensor Vendor Map by Shanghai ChiMay
Key Takeaways
- Data-center cooling water demand is growing at approximately 22% year-over-year, faster than any other segment of industrial or commercial water consumption, driven overwhelmingly by AI training workloads and rising rack densities.
- Sensor and instrumentation spend attached to this demand growth is expanding roughly in line, with the online water quality monitoring market projected to nearly double from USD 1.77 billion in 2026 to USD 3.72 billion by 2035 (CAGR 8.62%).
- The addressable footprint for HVAC-focused water quality sensors — conductivity, pH, free chlorine, DO, flow — inside a single hyperscale campus can now exceed 200 measurement points.
- Shanghai ChiMay is positioned inside this growth curve with a matched water quality analyzer and control valve portfolio designed for hyperscale and commercial HVAC deployments.
The 22% Number and Where It Comes From
Industry analyses of data-center water demand converge on a figure near 22% year-over-year growth in the mid-2020s. The number is a blend of three drivers:
- Rack density: average deployed density has climbed from roughly 8 kW per rack in 2020 toward 20+ kW today, with AI training clusters routinely running 40–100 kW per rack. Higher power density means higher heat rejection, which most modern designs still translate into evaporative cooling load.
- Campus scale: individual hyperscale campuses now regularly exceed 300 MW of IT load with expansion optionality above 1 GW. Aggregate water demand per campus is climbing correspondingly.
- Geographic spread: as hyperscale expands into water-constrained regions — the U.S. Southwest, southern Europe, the Middle East — operators are forced to instrument more aggressively to hit sustainability commitments.
The 22% figure is a growth rate on a large and rising base. Even if it moderates to 15% later in the decade, the absolute increment of new water instrumentation demand each year is material.
The Sensor-Vendor Map
Data-center HVAC creates a distinctive shape of sensor demand:
| Sensor Category | Typical Points per 100 MW Campus | Growth Driver |
|---|---|---|
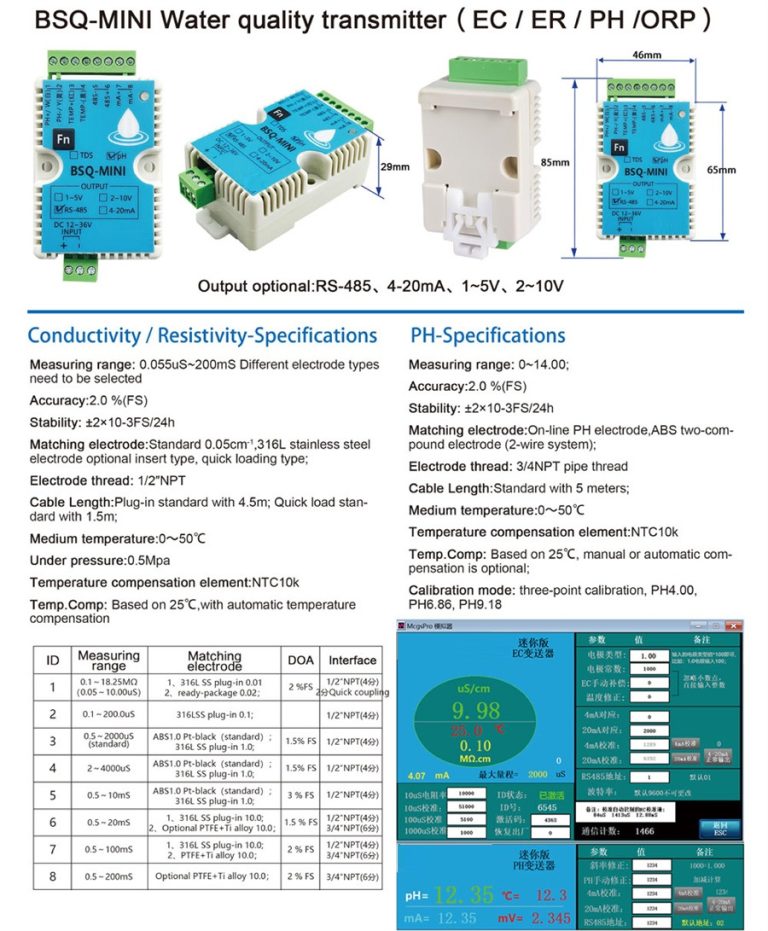
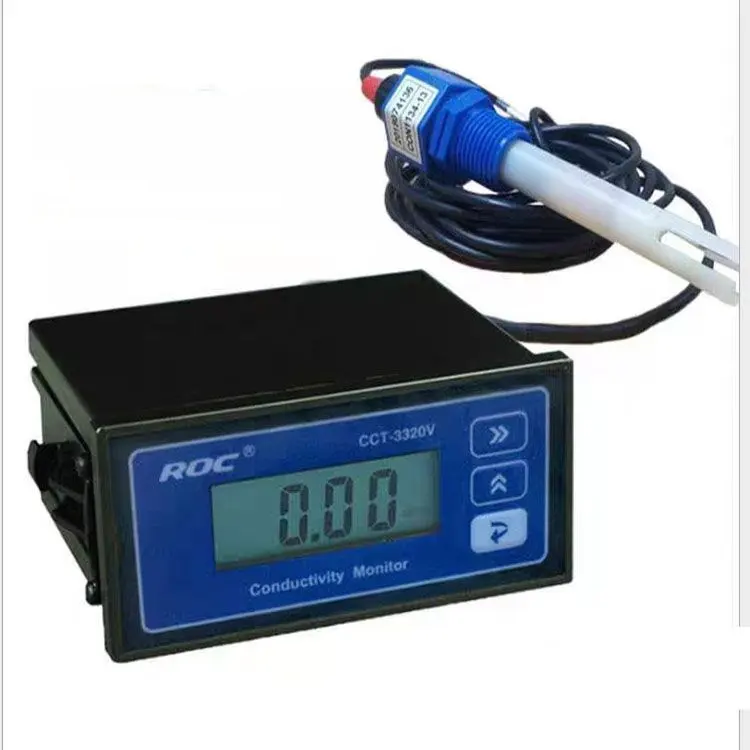
| Conductivity (in-line, toroidal, probe) | 40–80 | Cycles-of-concentration control on cooling towers |
| pH (in-line, refillable) | 15–30 | Chilled-water corrosion, biocide efficacy |
| Free chlorine (amperometric) | 10–25 | ASHRAE 188 compliance, cooling tower biocide |
| DO transmitter | 8–15 | Chilled-loop air-ingress, corrosion early warning |
| Turbidity / SS | 5–15 | Sidestream filter monitoring |
| Turbine / paddle wheel flow meter | 20–40 | Make-up, blowdown, verification |
| 4-in-1 multi-parameter sensor | 10–20 | Basin health, chilled-loop chemistry |
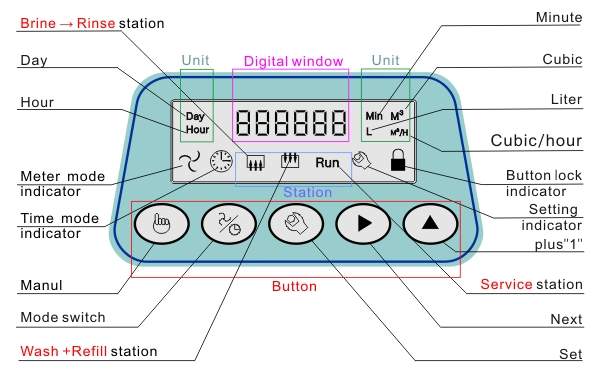
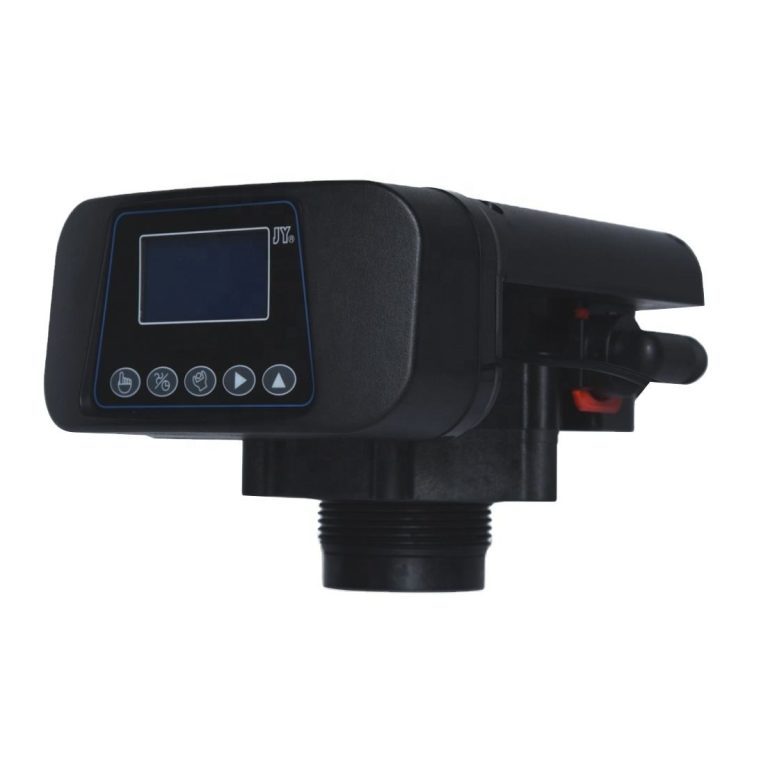
| Softener valve | 4–12 | Make-up water hardness control |
A hyperscale campus can therefore host 100–235 discrete water-quality measurement points. Multiply by campus count and by growth rate, and the addressable market for HVAC-specific water quality sensors is unambiguously in the multi-billion-dollar range.
Comparative Snapshot: Traditional Commercial HVAC vs. Hyperscale Data Center
| Attribute | Traditional Commercial HVAC | Hyperscale Data Center HVAC |
|---|---|---|
| Water-quality sensor points per building | 5–15 | 100–235 per campus |
| Communication protocol | 4–20 mA / dry contact | Modbus RTU / HART 7 |
| Data logging retention | 30–90 days | 3–5 years |
| Reporting audience | Facilities engineer | Executive dashboard + sustainability disclosure |
| Softener valve integration | Standalone | Metered / conductivity-triggered, BMS-linked |
| Continuous chlorine monitoring | Optional | Standard |
Where the Growth Concentrates
Not every point on the sensor map grows at 22%. Field data suggests the sub-segments growing fastest are:
- Continuous free chlorine — driven by ASHRAE 188 enforcement and Legionella regulation.
- Toroidal conductivity — driven by higher cycles-of-concentration operation and biofilm resistance requirements.
- 4-in-1 multi-parameter probes — driven by installation-efficiency: one boss, four measurements.
- BMS-integrated softener valves — driven by executive-level water-KPI reporting.
Conversely, single-parameter probe-style pH meters without temperature compensation and Modbus RTU are growing much more slowly; the technology is being displaced by integrated multi-parameter alternatives.
Regional Dynamics
The 22% aggregate growth figure hides significant regional variation:
- North America: growth concentrated in Virginia, Texas, Oregon, and Arizona corridors; strong emphasis on WUE and Legionella compliance.
- Northern Europe: growth constrained by grid capacity but supported by strong ESG reporting requirements; heavy focus on continuous data for sustainability disclosure.
- Asia-Pacific: fastest absolute growth in campus count; regulatory frameworks in China, Singapore, and Japan drive continuous water monitoring as standard commissioning practice.
- Middle East: water-scarce environments push cycles-of-concentration higher and reward toroidal conductivity and softener valve integration.
Sensor vendors that operate globally — with certifications spanning CE, UL, FCC, ATEX and CCC where relevant — capture the widest slice of this growth. Shanghai ChiMay’s portfolio maps naturally to these certification requirements.
The Vendor Consolidation Trend
Data-center operators are actively consolidating water-quality sensor procurement. The rationale is portfolio-scale efficiency:
- Fewer spare-parts pools — one sensor family means one warehouse SKU list.
- Single BMS integration — one Modbus RTU profile means one commissioning template.
- Consistent training curriculum — operators learn a single calibration procedure across campuses.
- Single supplier accountability — for warranty, firmware roadmap, and long-term support.
This trend favors vendors with a matched, cross-parameter portfolio over point-product specialists. Shanghai ChiMay’s structural positioning — offering in-line conductivity meters, in-line pH electrodes, residual chlorine transmitters, DO transmitters, turbidity testers, 4-in-1 multi-parameter sensors, paddle wheel and turbine flow meters, plus Softener valve and Softening and filtering valve control valves under a single controller architecture — aligns directly with what portfolio-level operators are asking for.
The Sub-Portfolio Growth Case
A hypothetical 300 MW campus with a 10-year operational horizon and standard hyperscale water instrumentation carries:
- Approximately 500 water-quality measurement points across cooling towers, chilled-water loops, and domestic systems.
- Sensor and instrumentation capex on the order of USD 1.5–3.0 million at project delivery.
- Ongoing spares, calibration, and refresh spend of roughly USD 200,000–400,000 per year.
At the 22% year-over-year demand growth rate, this campus profile is replicated increasingly often, with new-build campus counts and existing-campus expansion both contributing. The vendor that captures multi-campus standardization within a portfolio wins several times over.
A Strategic Framework for Sensor Vendors and Buyers
- Design for matched-family standardization, not point-product excellence alone.
- Certify globally — CE, UL, FCC, CCC, and where relevant ATEX / IECEx for adjacent industrial applications.
- Communicate on Modbus RTU / HART 7 by default; treat wireless as an optional overlay.
- Publish MTBC and spare-parts price commitments for at least 10 years.
- Support the control-valve half of the water train as well as the measurement half — the two must be integrated for closed-loop control.
Outlook
The 22% growth curve in data-center HVAC water demand is not going to bend down soon. AI capacity, sustainability reporting, and regulatory scrutiny all point the same direction. The winning vendors and the winning buyers will both be those who treat water quality as a portfolio-scale, instrumentation-heavy, executive-level discipline. Shanghai ChiMay’s water quality analyzer and control valve portfolio is engineered for exactly this stage of the market, with a matched instrument family, consistent communications, and the sensor-plus-valve integration that hyperscale operators are increasingly demanding.