Table of Contents
From Seawater to Drinking Water: The Complete RO Desalination Monitoring Guide
Key Takeaways:
– RO desalination produces 60% of global desalinated water
– Modern monitoring systems can reduce operational costs by 25-35%
– Real-time data enables predictive maintenance that extends membrane life by 40%
Introduction
The journey from seawater to potable water involves complex physical and chemical processes that demand precise monitoring and control. Understanding how water quality parameters change through each stage—and why they matter—helps operators optimize performance and ensure consistent product quality.
This comprehensive guide takes you through the complete desalination process, examining monitoring requirements at each stage and explaining how strategic measurement drives operational excellence.
Stage 1: Seawater Intake and Screening
Process Overview
Raw seawater enters the facility after passing through intake structures designed to minimize debris and marine organisms. Water quality at this stage establishes baseline conditions that influence all subsequent processing.
Key Monitoring Parameters
Intake Water Quality:
– Turbidity: Establishes baseline suspended solids
– Temperature: Affects all subsequent measurements
– Salinity: Typical range 32-42 ppt (parts per thousand)
– pH: Baseline 7.8-8.2 for seawater
– Dissolved oxygen: 5-8 mg/L depending on temperature
Monitoring Significance
Early baseline measurements enable:
– Pretreatment optimization
– Process adjustment for seasonal variations
– Fouling potential assessment
– Intake system performance evaluation
Stage 2: Pretreatment
Process Overview
Pretreatment removes suspended solids, adjusts chemical properties, and prepares water for membrane processing. This stage typically includes:
– Screening and filtration
– pH adjustment
– Chemical addition (antiscalants, biocides)
– Coagulation and flocculation
Key Monitoring Parameters
Pre-filtration:
– Turbidity: < 50 NTU target before multimedia filtration
– Particle counts: Indicator of filtration effectiveness
– SDI (Silt Density Index): < 5 required for RO
Post-filtration:
– Turbidity: < 1 NTU target for RO feed
– Residual particles: < 10 particles/mL above 10 μm
– pH: Adjusted to optimal range for membrane protection
Chemical Dosing Control
| Chemical | Dosing Point | Monitoring Parameter | Target Range |
|---|---|---|---|
| Acid | Pre-membrane | pH | 7.0-7.5 |
| Antiscalant | Pre-membrane | Dose rate | Supplier-specific |
| Biocide | Intake | Chlorine | 1-3 mg/L |
| Flocculant | Clarifier | Residual | 0.5-2 mg/L |
Monitoring Significance
Pretreatment monitoring ensures:
– Adequate particle removal before RO
– Optimal chemical dosing (neither under nor overdosing)
– Fouling potential management
– Pretreatment system efficiency tracking
Stage 3: High-Pressure Pumping
Process Overview
Seawater is pressurized to the pressure required for reverse osmosis—typically 800-1,200 psi for seawater applications. This stage consumes the majority of system energy.
Key Monitoring Parameters
Pump Performance:
– Feed pressure: Primary energy indicator
– Flow rate: Production capacity indicator
– Energy consumption: kWh per cubic meter produced
System Condition:
– Pump vibration: Mechanical health indicator
– Seal integrity: Leak detection
– Bearing temperature: Overheating prevention
Energy Optimization
Energy consumption monitoring enables:
– Pump efficiency tracking
– Variable frequency drive optimization
– Recovery rate adjustment based on conditions
– Energy audit and benchmarking
Industry Data
- Average energy consumption: 3.0-4.0 kWh/m³
- Well-optimized facilities: 2.5-3.0 kWh/m³
- Energy represents 40-50% of total operating costs
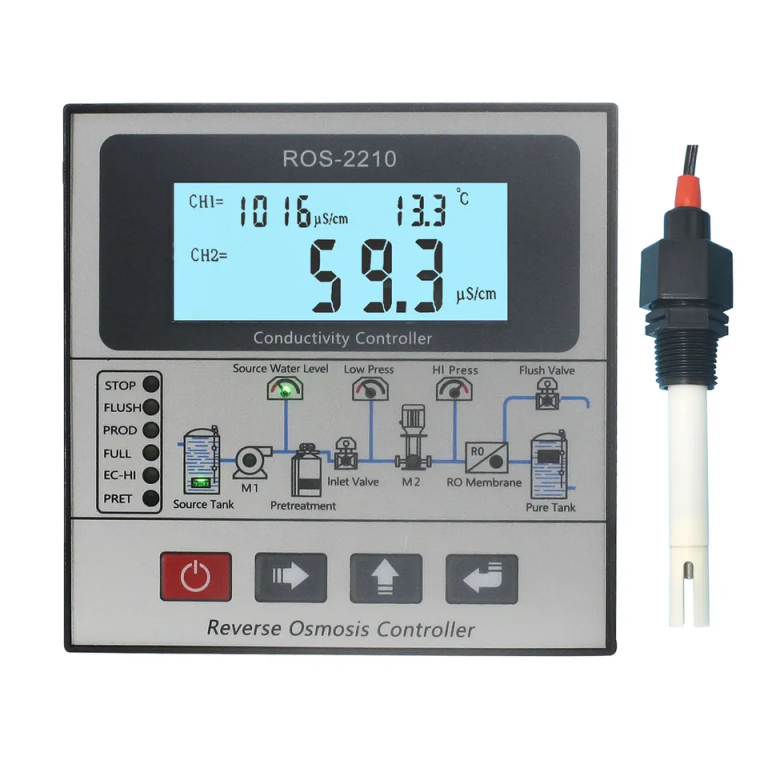
Stage 4: Reverse Osmosis
Process Overview
The heart of the desalination process, RO uses semipermeable membranes to separate fresh water from dissolved salts. This stage requires precise monitoring to maintain performance and protect membranes.
Key Monitoring Parameters
Membrane Performance:
– Salt rejection rate: > 99% target for seawater
– Permeate conductivity: < 500 μS/cm (drinking water)
– Flux rate: 12-20 LMH typical
– Recovery rate: 35-50% for seawater
Feedwater Quality:
– Conductivity: 45-55 mS/cm typical
– Temperature: Affects flux and rejection
– pH: Scaling potential indicator
– SDI: Fouling risk assessment
Membrane Health:
– Differential pressure: Fouling indicator
– Salt passage: Membrane integrity
– Normalized flux: Performance trending
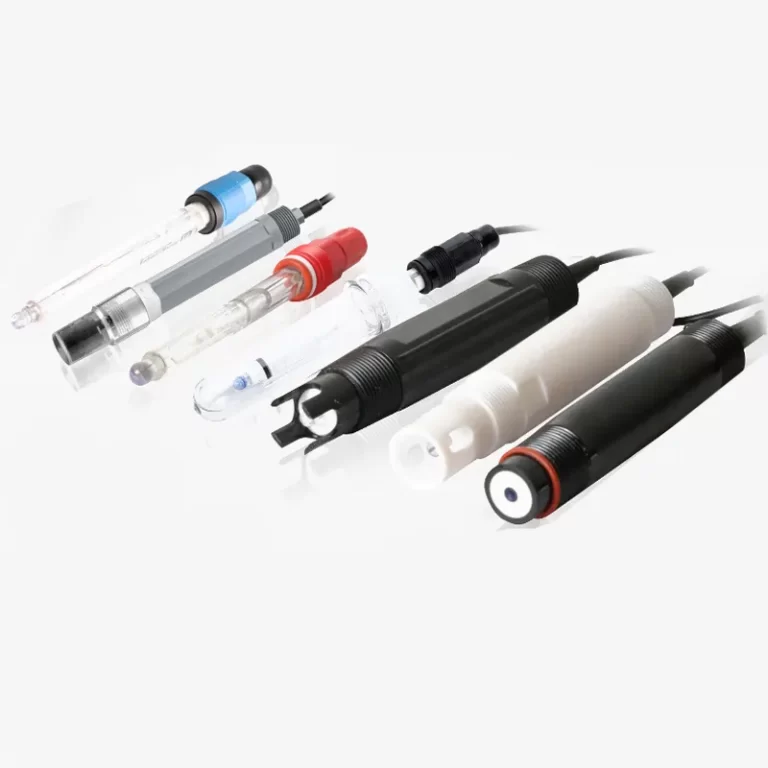
Monitoring Technologies
Conductivity Sensors:
– Four-electrode design for accuracy
– Temperature compensation essential
– Materials: Titanium or Hastelloy for seawater
Pressure Sensors:
– Transmitter accuracy: ±0.1% typical
– Analog output: 4-20 mA standard
– Sealing: Double-compartment design
Flow Sensors:
– Electromagnetic or ultrasonic technology
– Accuracy: ±1% of flow rate
– Installation: Upstream straight run required
Data Analysis
Continuous monitoring enables:
Performance Calculation:
– Normalized permeate flow (NPF)
– Normalized salt passage (NSP)
– Differential pressure trends
– Recovery optimization
Predictive Maintenance:
– Fouling progression tracking
– Cleaning requirement prediction
– Membrane replacement timing
– Failure mode identification
Stage 5: Product Water Treatment
Process Overview
Permeate from the RO process receives final adjustment before distribution:
– pH correction (if needed)
– Chlorination for disinfection
– Mineral addition for stability
– Quality verification
Key Monitoring Parameters
Product Quality:
– pH: 7.0-8.5 target
– Conductivity: < 500 μS/cm
– Chlorine residual: 0.2-0.5 mg/L
– Turbidity: < 1 NTU
Compliance Monitoring
Regulatory requirements typically specify:
– WHO Guidelines: Conductivity < 250 μS/cm (preference < 500)
– US EPA: pH 6.5-8.5, chlorine residual > 0.2 mg/L
– EU Directive: TDS < 1,500 mg/L, pH 6.5-9.5
Stage 6: Concentrate Disposal
Process Overview
The concentrated brine byproduct requires appropriate disposal or utilization. Proper monitoring ensures environmental compliance and enables resource recovery.
Key Monitoring Parameters
Concentrate Characterization:
– Flow rate: Volume tracking
– Salinity: Concentration factor indicator
– Temperature: Thermal impact assessment
– Chemical composition: Discharge permit compliance
Environmental Monitoring
Concentrate discharge monitoring includes:
– Salinity and density gradients
– Dissolved oxygen depletion potential
– Chemical contaminant levels
– Marine ecosystem impact indicators
Integration and Control
SCADA System Integration
Modern desalination facilities integrate all monitoring data through SCADA systems:
Data Collection:
– Continuous sensor data acquisition
– Multiple communication protocols
– Data validation and filtering
– Historical storage and trending
Control Functions:
– Automated chemical dosing
– Alarm management
– Process optimization algorithms
– Remote operation capabilities
Predictive Analytics
Advanced facilities implement predictive analytics:
– Machine learning models for fouling prediction
– Optimization algorithms for energy reduction
– Asset management integration
– Production planning tools
Best Practices
Calibration Management
Effective monitoring requires rigorous calibration:
– Sensor-specific calibration schedules
– NIST-traceable standards
– Documentation and audit trail
– Out-of-specification response protocols
Maintenance Protocols
Regular maintenance ensures sensor accuracy:
– Sensor cleaning schedules
– Membrane inspection programs
– Calibration verification
– Spare parts management
Conclusion
From intake to product delivery, comprehensive monitoring at each desalination stage enables:
– Optimal process performance
– Membrane longevity
– Energy efficiency
– Product quality assurance
– Regulatory compliance
– Cost-effective operations
Shanghai ChiMay provides complete monitoring solutions for desalination applications, offering sensors, analyzers, and integration expertise that support operational excellence throughout the treatment process.