Key Takeaways:
- Unplanned equipment failures cost water utilities $8-15 billion annually in the U.S.
- Predictive maintenance reduces equipment failures by 50-70%
- Typical payback period for monitoring systems: 8-16 months
Water treatment equipment operates in demanding environments—corrosive chemicals, abrasive slurries, biological fouling, and continuous operation requirements create relentless stress on mechanical and instrumentation systems. The traditional "run-until-failure" maintenance approach increasingly proves inadequate for modern operational and regulatory requirements.
Predictive maintenance (PdM) uses real-time monitoring and data analysis to anticipate equipment degradation, enabling proactive intervention before failures occur. This approach transforms maintenance from a cost center to a value-creation function.
Table of Contents
The Economics of Equipment Failure
Direct Costs
Equipment repair or replacement:
- Pumps: $3,000-50,000+ for repair; $5,000-200,000 for replacement
- Motors: $1,000-15,000 for repair; $2,000-50,000 for replacement
- Sensors: $500-8,000 for replacement
- Valves and actuators: $1,000-25,000 depending on size and complexity
Labor costs:
- Emergency repair: 2-5x normal labor rates due to overtime, expediting
- Unscheduled downtime: Typically 4-8 hours for diagnosis and repair
- Post-failure analysis: 8-16 hours for root cause investigation
Indirect Costs
Often exceeding direct costs:
Production losses:
- Water treatment interruption: Affects downstream processes
- Permit compliance violations: Fines ranging from $1,000-50,000/day
- Customer service impacts: Pressure reductions, boil advisories
Secondary damage:
- Cascading failures: One failure causes others
- Environmental releases: Chemical spills, overflows
- Equipment damage: Beyond initial failed component
Operational inefficiency:
- Suboptimal operating conditions: Equipment run harder to compensate
- Energy waste: Inefficient operation during degraded performance
- Quality excursions: Reduced treatment effectiveness
Industry analysis by the U.S. Department of Energy indicates that water and wastewater utilities experience equipment-related losses of $8-15 billion annually, with 35-50% potentially preventable through predictive maintenance approaches.
Technology Foundation for Predictive Maintenance
Condition Monitoring Parameters
Mechanical wear indicators:
| Parameter | Measurement | Failure Mode | Warning Time |
|---|---|---|---|
| Vibration | Accelerometers, displacement sensors | Bearing wear, misalignment | 2-4 weeks |
| Temperature | RTDs, thermocouples, IR sensors | Overheating, lubrication failure | 1-2 weeks |
| Current draw | Current transformers | Motor degradation, pump issues | 2-4 weeks |
| Noise | Acoustic sensors | Cavitation, bearing failure | 1-3 weeks |
Process performance indicators:
| Parameter | Measurement | Failure Mode | Warning Time |
|---|---|---|---|
| Flow | Electromagnetic, ultrasonic meters | Pump degradation, blockages | 1-4 weeks |
| Pressure | Pressure transmitters | Clogging, valve failures | 1-2 weeks |
| Power consumption | Power meters | Efficiency degradation | 2-6 weeks |
| Performance curves | Multi-parameter analysis | Systematic degradation | 4-8 weeks |
Water Quality Sensor Health Monitoring
Sensor-specific diagnostics:
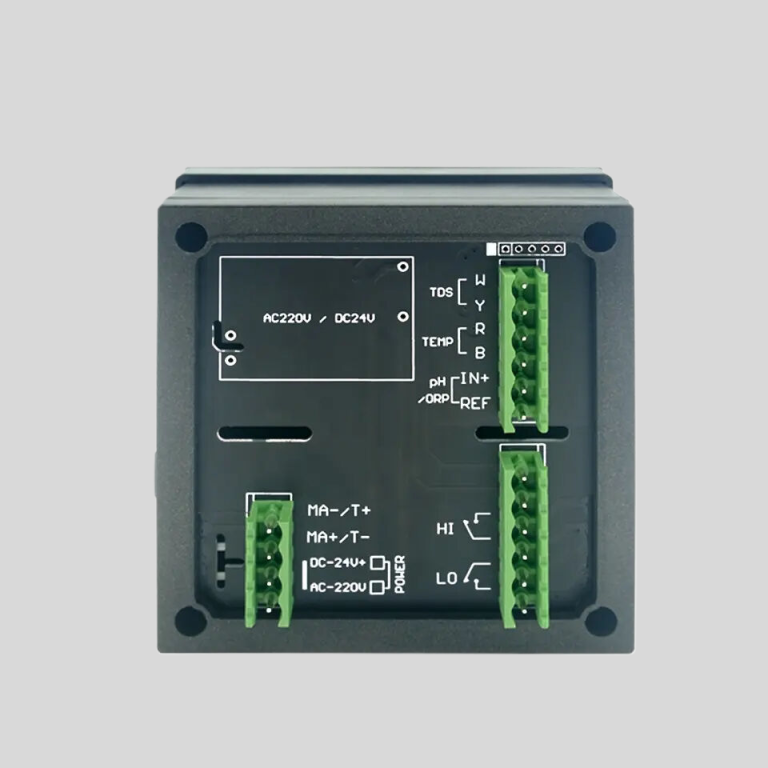
pH and ORP sensors:
- Glass resistance: Indicates membrane condition
- Reference impedance: Indicates reference junction health
- Slope and offset: Classic calibration parameters
- Response time: Degradation indicator
Conductivity sensors:
- Cell constant drift: Indicates electrode surface changes
- Temperature coefficient drift: Indicates polymer degradation
- Zero stability: Indicates electronic issues
- Signal strength: Fluorescence sensor aging
- Response time: Membrane fouling
- Dark current drift: LED or detector degradation
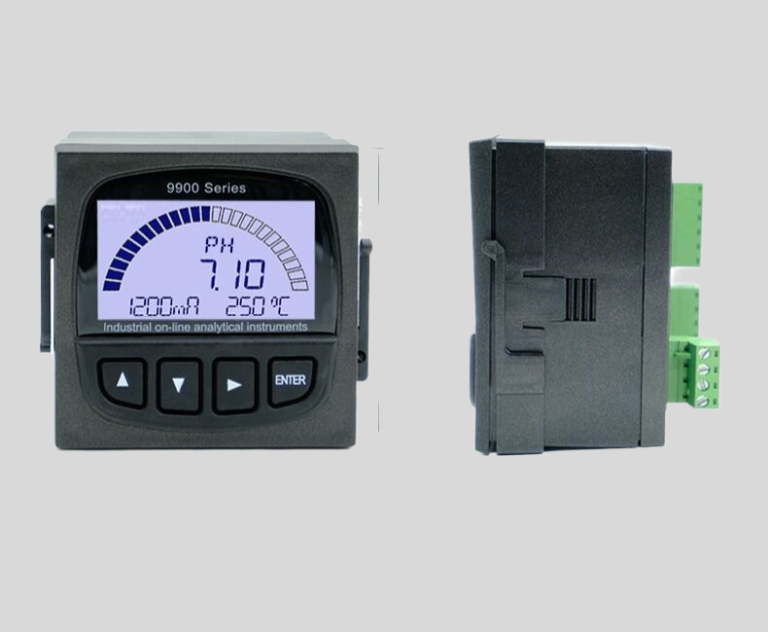
ChiMay inline pH electrodes include diagnostic features enabling remote health assessment:
- Built-in temperature compensation
- Diagnostic parameters via HART protocol
- Anti-fouling reference junction reducing maintenance
Data Analysis Approaches
Statistical Process Control (SPC)
Baseline establishment:
- Normal operating ranges: 99.7% confidence intervals (3-sigma)
- Trend analysis: Detecting gradual degradation
- Control charts: Identifying out-of-control conditions
Application to water quality sensors:
- Calibration drift tracking: Monitoring slope and offset changes
- Cross-parameter validation: Correlated measurements detecting sensor errors
- Environmental correlation: Temperature or flow-affected measurement corrections
Machine Learning Models
Supervised learning:
- Failure classification: Categorizing failure modes based on symptoms
- Remaining useful life (RUL) estimation: Predicting time until failure
- Anomaly classification: Distinguishing real events from sensor errors
Unsupervised learning:
- Novelty detection: Identifying previously unseen failure modes
- Clustering: Grouping similar operational conditions
- Association rules: Finding correlated parameter changes
Implementation example:
A municipal water utility deployed machine learning for critical pump monitoring:
- Input features: Flow, pressure, vibration, current, temperature, power factor
- Target variables: Maintenance events, failure occurrences
- Model type: Random Forest classifier with gradient boosting
- Results: 73% of failures predicted with more than 48 hours warning
Digital Twin Technology
Virtual equipment models simulate operational behavior:
- Physics-based models: Calculate expected performance from operating conditions
- Real-time comparison: Detecting deviations from expected behavior
- What-if analysis: Predicting outcomes of operational changes
- Optimization: Identifying best operating setpoints
Application to chemical dosing systems:
- Dosing pump digital twin: Models expected output based on stroke settings and pressure
- Real-time comparison: Detects pump degradation or valve issues
- Optimization: Identifies minimum effective dosing rates
Implementation Framework
Phase 1: Assessment (Months 1-3)
Equipment prioritization:
| Priority | Criteria | Equipment Examples |
|---|---|---|
| Critical | Single point of failure, high failure cost | Primary pump, UV bank, critical sensors |
| High | Significant failure cost, some redundancy | Secondary pumps, chemical systems |
| Medium | Moderate failure cost, available redundancy | Auxiliary equipment, sampling systems |
Baseline data collection:
- Historical failure records (2-5 years minimum)
- Current maintenance procedures and costs
- Equipment inventory and specifications
- Sensor and control system capabilities
Phase 2: Monitoring Deployment (Months 3-9)
Sensors and instrumentation:
- Vibration sensors: Wireless or wired depending on location
- Temperature sensors: Infrared, contact, or wireless
- Current sensors: Clip-on CTs for non-invasive installation
- Process instruments: Enhanced monitoring on critical points
Data infrastructure:
- Edge computing: Local data processing reducing bandwidth
- Time-series databases: Optimized for continuous data
- Analytics platforms: Cloud or on-premise depending on requirements
- Visualization tools: Dashboards and alerting systems
Phase 3: Analysis and Optimization (Months 9-18)
Model development:
- Statistical baselines: Historical performance characterization
- Machine learning models: Trained on facility-specific data
- Threshold refinement: Adjusting based on operational feedback
- Integration with CMMS: Work order generation and tracking
Process optimization:
- Maintenance interval optimization: Extending intervals where appropriate
- Operating parameter refinement: Reducing wear through better control
- Spare parts optimization: Right-sizing inventory based on predicted failures
Return on Investment Analysis
Consider a regional water authority operating 12 pumping stations, 8 treatment facilities, and 500+ miles of distribution mains:
Baseline maintenance costs:
- Preventive maintenance: $1.2 million/year
- Corrective maintenance: $1.8 million/year
- Emergency repairs: $600,000/year
- Total maintenance: $3.6 million/year
- Unplanned downtime costs: $800,000/year
Predictive maintenance investment:
- Monitoring sensors and hardware: $450,000
- Software platform (5-year license): $300,000
- Installation and commissioning: $150,000
- Training and change management: $100,000
- Total first-year investment: $1,000,000
Projected improvements:
| Category | Improvement | Annual Value |
|---|---|---|
| Emergency repairs | 65% reduction | $390,000 |
| Corrective maintenance | 40% reduction | $720,000 |
| Downtime costs | 70% reduction | $560,000 |
| Energy efficiency | 8% improvement | $180,000 |
| Inventory optimization | 25% reduction | $75,000 |
| Total annual benefits | $1,925,000 |
First-year ROI: 92.5%
Payback period: 7 months
5-year NPV (10% discount rate): $5.4 million
Organizational Change Management
Technical implementation alone does not guarantee success. Effective predictive maintenance requires organizational adaptation:
Skill Development
Training requirements:
- Data literacy: Understanding statistical concepts and tool usage
- Analytical skills: Interpreting model outputs and trends
- Technical integration: Connecting sensors and systems
- Cross-functional collaboration: Sharing insights across departments
Training program structure:
| Level | Audience | Duration | Focus |
|---|---|---|---|
| Awareness | All staff | 4 hours | Concepts and benefits |
| User training | Operators | 16 hours | Dashboard and response |
| Technical training | Technicians | 40 hours | Sensors and maintenance |
| Advanced training | Analysts | 80 hours | Models and optimization |
Process Adaptation
Maintenance workflow changes:
- Scheduled reviews: Weekly anomaly review meetings
- Alert response procedures: Defined escalation paths
- Work order generation: Automated from predictive alerts
- Feedback loops: Tracking accuracy of predictions
Cultural transformation:
- From reactive to proactive: Shifting mindset from firefighting to prevention
- Data-driven decisions: Basing actions on evidence rather than intuition
- Continuous improvement: Iteratively refining approaches based on results
Emerging Trends
Artificial Intelligence Integration
Deep learning applications:
- Computer vision: Automated visual inspection of equipment
- Natural language processing: Extracting insights from maintenance records
- Reinforcement learning: Self-optimizing control systems
Internet of Things Expansion
Wireless sensor networks:
- Battery-powered sensors: Extended deployment without wiring
- Mesh networking: Resilient communication infrastructure
- Edge AI: Local intelligence reducing cloud dependency
Autonomous Operations
Self-optimizing systems:
- Closed-loop control: Automatic adjustments without human intervention
- Self-diagnosing equipment: Embedded intelligence reporting status
- Regenerative maintenance: Systems that maintain themselves
Predictive maintenance represents a strategic transformation in water treatment operations. The combination of advanced sensors, data analytics, and organizational adaptation creates sustainable competitive advantages through reduced costs, improved reliability, and enhanced compliance. Organizations that embrace this approach position themselves for long-term success in an increasingly demanding operational environment.