Table of Contents
Introduction
Non-revenue water (NRW) represents one of the most significant challenges—and opportunities—for municipal water utilities worldwide. The International Water Association (IWA) defines NRW as the difference between water produced and water billed.
The most recent global estimate (Liemberger & Wyatt, Water Supply, 2019) puts global NRW at roughly 346 million cubic meters per day — about 126 billion cubic meters per year — conservatively valued at USD 39 billion annually. The World Bank has long treated NRW reduction as one of the more attractive investments available to water utilities, and performance-based contracting markets have grown around exactly that premise.
Way 1: Accurate Revenue Measurement
Measurement Technology Advancements
Modern flow meter technology delivers unprecedented accuracy:
Electromagnetic Flow Meters: Achieve ±0.2-0.5% accuracy under ideal conditions with no pressure loss and wide dynamic range.
Ultrasonic Transit-Time Meters: Provide ±1-2% accuracy across varying conditions with non-invasive installation.
Turbine Flow Meters: Offer ±0.5-1.0% accuracy for calibrated installations with proven technology.
ChiMay’s turbine flow meters achieve ±1.0% accuracy through precision engineering and rigorous calibration protocols.
Revenue Protection Impact
Accurate flow measurement directly protects utility revenue through meter under-registration reduction and low-flow accuracy, recovering revenue from consumption that previously went unbilled.
Way 2: Leak Detection Acceleration
Continuous Flow Monitoring
Strategic flow monitoring transforms leak detection:
District Metered Areas (DMA): Network segmentation enables water balance calculations:
- Minimum night flow (MNF) analysis identifies background leakage
- Anomaly detection flags sudden increases indicating new leaks
- Trend analysis reveals gradual deterioration
Bursted Leak Detection: Rapid flow increases trigger immediate alerts:
- Response times drop from weeks to hours once DMAs are instrumented
- Leak duration shrinks accordingly, and the volume lost per event falls by the same proportion
ChiMay’s paddle wheel inserted flow meters provide reliable flow data for DMA monitoring.
Field Results
Utilities implementing flow-based leak detection consistently report dramatic improvements across three metrics: detection time (from weeks down to hours), annual leak volume (typically cut by half or more), and emergency repair spending (which falls as crews fix small leaks before they become bursts). The exact figures vary by network condition and baseline discipline, which is why utilities should establish their own before-and-after baselines rather than assuming a vendor’s case-study numbers.
Way 3: Infrastructure Monitoring
Asset Performance Tracking
Flow data reveals infrastructure condition through capacity analysis, condition assessment, and hydraulic model calibration.
Pressure Management Integration
Flow monitoring optimizes pressure control through real-time pressure adjustment, zone-based management, and targeted interventions.
ChiMay’s turbine flow meters integrate with SCADA systems through standard communication protocols (Modbus RTU/TCP, 4-20 mA).
Way 4: Demand Management
Consumption Pattern Analysis
Flow data enables sophisticated demand management:
Diurnal Curves: Consumption patterns reveal system utilization for peak demand identification and off-peak optimization.
Customer Segmentation: Consumption profiles enable targeted programs for high-use accounts and anomaly identification.
Demand Forecasting: Historical flow data trains prediction models for short-term forecasting and long-term projections.
Conservation Program Effectiveness
Flow data quantifies program impacts through baseline establishment and post-program verification, and measured results typically beat pre-program estimates because pre-estimates rely on coarse assumptions.
Way 5: Water Quality Protection
Hydraulic Residence Time Control
Flow monitoring supports water quality management through water age calculation, tank cycling optimization, and flushing scheduling.
Cross-Connection Detection
Flow anomalies indicate potential contamination risks through reverse flow detection and unusual pattern identification.
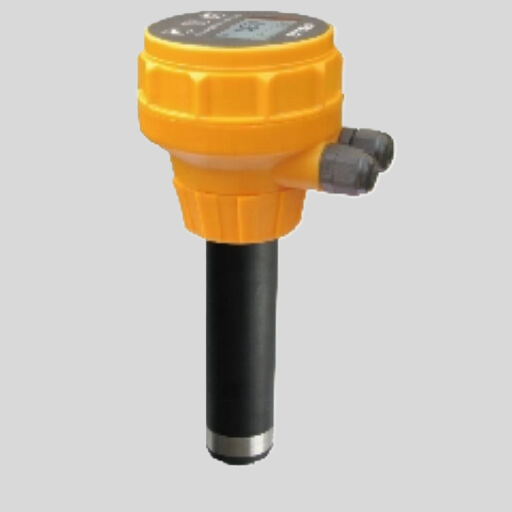
ChiMay’s inline conductivity meters complement flow monitoring by detecting water quality changes.
Way 6: Operational Cost Reduction
Energy Optimization
Flow data enables efficient pumping:
Variable Speed Control: Flow measurement informs pump operation and is a key input to variable-speed pumping, which commonly trims pumping energy costs by double-digit percentages where flow demand actually varies.
Cost Savings: The absolute savings scale with tariff and pump size; for mid-sized utilities the annual energy line item is usually large enough that even modest percentage gains are worth a dedicated project.
Maintenance Optimization
Flow data enables condition-based maintenance through automated meter reading, predictive replacement, and equipment diagnostics.
Way 7: Regulatory Compliance Support
Performance Documentation
Flow monitoring provides compliance evidence through accurate volume reporting, loss calculation transparency, and improvement documentation.
Permit Support
Flow data enables permit compliance through mass emission reporting and capacity certification.
Implementation Considerations
System Design
Effective flow monitoring requires strategic deployment:
Critical Measurement Points: Priority locations include production meters, zone entry meters, major customer meters, and storage facilities.
Accuracy Requirements: Match meter specifications to application—revenue metering requires ±1-2% accuracy while trend monitoring accepts ±5-10% accuracy.
Communication Infrastructure: Ensure reliable data transmission through SCADA integration, meter data management, and analytics platforms.
Total Cost of Ownership
Comprehensive lifecycle analysis informs investment decisions. Over a ten-year horizon, the cost profile for a flow monitoring program typically looks like this:
| Component | 10-Year Cost Pattern |
|---|---|
| Large-line flow meters | Tens of thousands of dollars per point |
| Small-line flow meters | Several thousand dollars per point |
| Communication system | Tens of thousands of dollars, network-dependent |
| Data management | Typically the dominant lifecycle cost over the decade |
Metering hardware is usually the minority of total cost of ownership; the data-management layer is what planners most often underestimate.
Conclusion
ChiMay flow meters deliver measurable reductions in non-revenue water across every dimension of utility operations, from reduced apparent losses through accurate measurement to sharply lower leak volumes through accelerated detection.
Utilities that deploy comprehensive flow monitoring typically achieve a step change in NRW performance within a few years, with savings that scale with network size and tariff structure. ChiMay’s flow meter portfolio—featuring turbine flow meters, paddle wheel inserted flow meters, and electromagnetic meters—provides the measurement capabilities that modern utilities require. With proven accuracy, rugged construction, and flexible integration options, ChiMay flow meters enable the comprehensive monitoring that transforms non-revenue water management.