Drinking water safety depends on continuous vigilance. Municipal systems have to deliver water that is microbiologically safe, chemically compliant and acceptable to consumers, and they have to do it every day, over networks that are largely buried and rarely inspected. Monitoring is what makes that possible.
The U.S. Environmental Protection Agency (EPA) and equivalent authorities elsewhere set minimum monitoring requirements. Utilities that treat compliance as the target rather than the floor generally get more out of their monitoring budget. Three sensor categories do most of the work.
Table of Contents
Sensor 1: Chlorine Residual Monitors
Why Chlorine Monitoring Matters
Chlorine is still the most widely used drinking water disinfectant. The principle is simple: hold a minimum concentration throughout the distribution system and microbial regrowth does not get a foothold.
The difficulty is that chlorine does not hold still. Residual drops for several reasons:
- Reaction with organic matter: natural organic compounds consume chlorine as water travels
- Natural decay: chlorine degrades over time through chemical reactions
- Pipe wall demand: biofilm and corrosion products consume disinfectant
- Temperature: warmer water accelerates decay
Without continuous measurement, a utility has no way of knowing whether protection survives to the far end of the network. Weekly grab samples at fixed points will not tell you what happened on Tuesday night.
Regulatory Requirements
Two different rules are often conflated, so it is worth being precise.
Under the EPA’s Surface Water Treatment Rule, the residual disinfectant concentration entering the distribution system cannot fall below 0.2 mg/L for more than four hours (40 CFR 141.72). Within the distribution system, the rule requires a detectable residual in at least 95% of samples each month. That is a floor at the entry point plus a presence test across the network, not a continuous 0.2 mg/L mandate at every tap.
The Stage 2 Disinfectants and Disinfection Byproducts Rule works differently: it regulates TTHM and HAA5 as locational running annual averages and increases monitoring when a site runs high. It is not the rule that sets the 0.2 mg/L residual value.
The EU Drinking Water Directive 2020/2184 takes a similar approach — disinfectant residual monitoring at specified frequencies, with the numerical limits left to national implementation.
Technology Options
Amperometric sensors measure chlorine by electrochemical reaction at the electrode surface. Typical performance for continuous duty:
- Response time: 30–60 seconds
- Accuracy: around ±5% of reading under stable conditions
- Maintenance: weekly electrode cleaning, monthly calibration
Colorimetric analysers develop a colour with a reagent and measure it. Accurate, but you are now buying reagents and managing their disposal.
UV absorbance at 254 nm does not measure chlorine directly. It measures organics, which correlate with chlorine demand — useful as a leading indicator of the conditions that will burn residual faster.
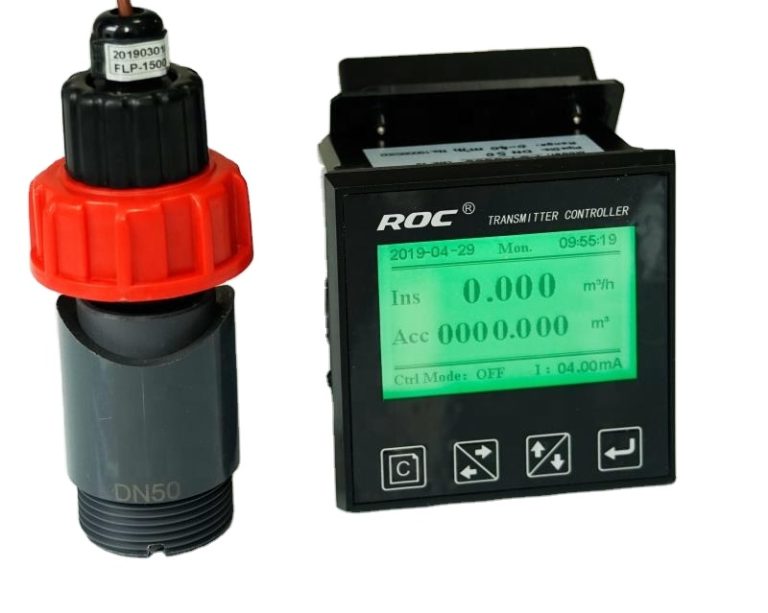
Shanghai ChiMay’s chlorine residual transmitters use amperometric sensing with automatic temperature compensation and pH correction, which is what keeps the reading stable when the water quality shifts.
Where to Install Them
- Entry points to the distribution system — confirms treatment is working before water leaves the plant
- Major transmission mains — shows what survives bulk transport
- Pressure zone boundaries — the points most likely to run low
- Storage facility outlets — protection after detention time
- Critical customer locations — hospitals, food processing, dialysis
Sensor 2: Turbidity Monitors
Understanding Turbidity
Turbidity is a measure of clarity — how much suspended material scatters light. It matters as an aesthetic parameter, but its real value is as a surrogate:
- Microbial contamination: particles shield bacteria, viruses and protozoa from disinfection
- Coagulation performance: turbidity guides dose control
- Pipe condition: rising turbidity can mean corrosion or biofilm disturbance
- Upsets: a sudden increase signals something changed in the system
The World Health Organization treats turbidity as an early warning indicator of treatment or distribution problems, which is how most utilities use it operationally.
Regulatory Framework
The EPA’s Long Term 2 Enhanced Surface Water Treatment Rule (LT2) works through the filtration treatment technique in 40 CFR 141.173. For conventional and direct filtration plants, filtered water turbidity must be ≤0.3 NTU in at least 95% of measurements each month, and must never exceed 1 NTU. Systems also monitor individual filters, which is where the useful diagnostic information sits — combined filter effluent can look fine while one filter is out of condition.
Note the direction of the numbers. It is 0.3 NTU that carries the 95% requirement, with 1 NTU as the absolute ceiling.
Nephelometric Measurement Technology
Modern turbidity measurement is nephelometric: light scattered at 90° from the incident beam. ISO 7027 specifies the method — infrared LED at 860 nm, detection angle 90° ± 2.5°, formazin-based calibration standards.
Typical performance for continuous instruments:
- Range: 0–10,000 NTU depending on the model and application
- Accuracy: ±2% of reading or 0.02 NTU, whichever is greater
- Response: 1–5 seconds
Deployment Considerations
Monitoring points worth covering:
- Raw water intake — baseline before treatment
- Coagulation/flocculation effluent — process control feedback
- Filter effluent — the compliance point
- Clearwell outlet — final check before distribution
- Distribution locations — verifies nothing changed in transit
Self-cleaning sensors with wiper mechanisms are worth the extra cost where solids loading is high. Manual cleaning intervals of a week become a month, and a fouled window is the most common cause of a turbidity reading that does not make sense.
Sensor 3: pH Meters
Why pH Matters
pH affects almost everything downstream:
- Corrosion control — low pH attacks metal pipe and dissolves lead and copper
- Disinfection — hypochlorous acid dominates at lower pH; chlorine is far less effective as pH rises
- Metal solubility — high pH precipitates metals, low pH puts them back into solution
- Treatment chemistry — coagulation and softening only work inside their pH windows
Holding pH steady across the distribution system is what protects both the infrastructure and the water quality at the tap.
EPA Monitoring Requirements
The Lead and Copper Rule requires pH monitoring at entry points where corrosion control treatment is applied, and at representative locations in the distribution system, with action triggered when pH leaves the optimal range for the corrosion control strategy in use.
The secondary standard for pH is 6.5 to 8.5, which is an aesthetic range rather than a health-based limit.
Electrode Technology
Glass combination electrodes remain the standard for drinking water pH:
- Glass membrane — potential proportional to hydrogen ion activity
- Reference electrode — stable reference potential
- Temperature sensor — automatic temperature compensation, which is not optional if you want accuracy better than a few tenths
Typical specifications:
- Range: 0–14 pH
- Accuracy: ±0.02 pH
- Response: under 30 seconds to 95% of final reading
- Stability: drift under 0.01 pH per week
Maintenance Requirements
pH electrodes need attention, and skipping it is the usual reason a “bad” pH reading turns out to be a bad sensor:
- Storage: keep the reference junction wet
- Cleaning: weekly inspection, gentle cleaning of deposits
- Calibration: at least monthly against certified buffers
- Replacement: typically every one to two years
Differential electrodes with dual reference junctions resist contamination better and stretch maintenance intervals in dirty water.
Multi-Parameter Monitoring Solutions
Integrated Platforms
Separate instruments for each parameter multiply installation cost: more taps, more conduit, more cable, more panel space. Multi-parameter sondes put several sensors in one deployment:
- One installation point for all parameters, which cuts civil and electrical work
- Simultaneous measurement, so correlations between parameters are meaningful
- Space freed up in existing panels and kiosks
- One maintenance visit covering everything on the platform
Shanghai ChiMay’s multi-parameter stations combine chlorine residual, turbidity, pH, conductivity, dissolved oxygen and temperature in a compact assembly suitable for installation across a distribution system.
Data Integration and Alerting
Sensors alone do not make water safe. The data has to reach someone who can act:
SCADA integration puts current values and trends in front of operators, with alarms on threshold exceedance. Automated reporting produces the daily, monthly and annual records that regulators ask for without someone re-entering numbers into a spreadsheet — and it removes a common source of reporting errors.
What the Instrumentation Costs
Capital cost varies widely by vendor, specification and how much site work is involved. Indicative ranges for budgeting:
| Component | Typical range |
|---|---|
| Chlorine transmitter | $800–2,500 |
| Turbidity analyser | $1,000–3,000 |
| pH analyser | $500–1,500 |
| Multi-parameter station | $3,000–8,000 |
| Installation labour | $500–2,000 |
| Communications | $300–1,000 |
Ongoing costs are mostly consumables and labour: calibration standards, replacement sensors and electrodes, maintenance time, and communications fees. Budgeting annual upkeep at a few percent of the capital outlay is a reasonable starting assumption, though aggressive installations with heavy cleaning demand cost more.
The Return
Put the case in terms of what is avoided. A treatment technique violation is not cheap: the SDWA authorises civil penalties that are adjusted for inflation each year, reaching $71,545 per violation per day in 2025 — a figure set out in 40 CFR 19.4. Even a short-lived violation adds up quickly, and the notice requirements that come with it cost credibility as well as money.
Beyond penalties, continuous monitoring pays back through earlier detection: catching a coagulant feed failure, a filter breakthrough or a chlorine dosing problem during the shift it happens instead of weeks later. The savings show up as avoided repairs, fewer chemical overfeeds and fewer customer complaints.
Putting It Together
Chlorine residual, turbidity and pH are the three parameters that tell you whether a drinking water system is doing its job. They cover disinfection, particle removal and chemical stability — the failure modes that matter for public health.
Continuous monitoring of all three, with the data going somewhere useful, is the practical standard. Pick monitoring locations based on residence time and history rather than convenience, calibrate on a schedule you actually keep, and make sure someone owns the alarms.