Table of Contents
Summary
- Advanced oxidation reliably destroys micropollutants but can produce inorganic byproducts, notably bromate, chlorate, and various ionic transformation species, that raise effluent conductivity in a measurable pattern.
- Continuous conductivity trending is the cheapest, fastest surrogate for byproduct formation, delivering hours of warning before laboratory confirmation.
- Field experience from recent AOP retrofits is consistent: unexplained conductivity drift on the order of tens of microsiemens per centimeter tends to precede a clear rise in downstream bromate laboratory readings.
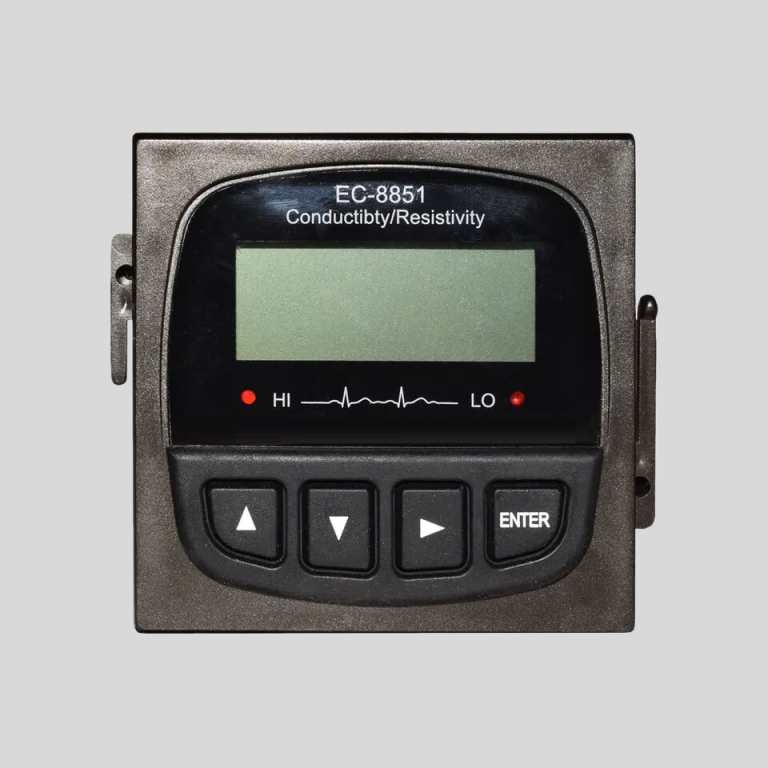
- Shanghai ChiMay’s in-line conductivity meter and analyzer product family, integrated with the wider AOP sensor stack, gives operators an early-warning signal that avoids surprise regulatory exceedances.
Why Conductivity Matters Downstream of AOP
Advanced oxidation processes create small but chemically important shifts in the ionic profile of treated water. Bromide oxidizes to bromate, chloride can oxidize to hypochlorite and chlorate, dissolved organic matter can degrade into carboxylate ions, and residual peroxide decomposition produces trace ionic species. Every one of these transformations lifts effluent conductivity by a small, predictable increment.
That increment is not by itself a compliance failure, but it is a reliable early indicator that byproduct formation has accelerated. Laboratory bromate measurements typically arrive 6-24 hours after sampling. Conductivity trending arrives continuously and highlights anomalies in near real time. That gap is what makes conductivity trending a valued diagnostic in modern quaternary treatment.
Baseline Establishment Before Trending
Effective conductivity trending starts with a baseline. Operators should document:
- Baseline effluent conductivity across at least 30 days of stable operation, ideally covering wet and dry weather flows.
- Diurnal variation range, since municipal influent conductivity typically drifts by tens of microsiemens per centimeter across a 24-hour cycle purely from influent load.
- Seasonal variation range, especially for plants receiving industrial or agricultural influent.
- Response of conductivity to controlled ozone step tests performed during commissioning, so the plant knows exactly how much conductivity drift is expected per unit of applied ozone.
Without a documented baseline, small drifts look like noise. With a baseline, small drifts look like alarms.
Sensor Requirements for Trending Duty
Conductivity analyzers deployed for AOP byproduct trending must satisfy specifications more demanding than routine process monitoring:
- Accuracy of +/- 1% or better across the operating range, since the diagnostic signal is a small percentage of the baseline value.
- Drift under 5 microsiemens per centimeter per 90 days without recalibration, achievable with high-quality four-electrode conductivity cells.
- Automatic temperature compensation to ISO 7888 or equivalent, since conductivity varies 2% per degree Celsius and thermal noise easily masks the byproduct signal.
- Documented cross-sensitivity to residual oxidants, since a fouled sensor reports drift that is instrument artifact rather than process reality.
- Modbus integration so the trending analysis can be centralized in the SCADA historian rather than done manually.
Shanghai ChiMay’s in-line conductivity meter and multi-parameter sensor product families are documented against these specifications and share a common Modbus register map with the wider AOP analyzer stack.
Interpretation Framework
A practical interpretation framework for conductivity trending on AOP effluent has three tiers:
- Green zone (baseline +/- 15 microsiemens per centimeter): no action required, routine operation.
- Amber zone (baseline +15 to +45 microsiemens per centimeter): trigger laboratory confirmation on the next scheduled bromate sampling, review recent influent bromide loading and applied ozone dose.
- Red zone (baseline +45 microsiemens per centimeter or higher): trigger immediate laboratory confirmation, throttle ozone dose to the minimum consistent with pharmaceutical compliance, prepare regulatory notification protocol.
These thresholds are plant-specific and require refinement during the first six months of operation, but they anchor operator decisions to numeric criteria rather than subjective judgment.
Combining Conductivity With Other Signals
Conductivity trending is powerful, but even more powerful in combination with other AOP sensor signals:
- ORP + conductivity: confirms whether unexpected byproduct formation is driven by ozone overdose or by upstream chemistry changes.
- pH + conductivity: flags whether influent alkalinity or upstream dosing chemistry is shifting.
- Turbidity + conductivity: helps rule out upstream sand filter breakthrough as a cause of ionic drift.
- Residual oxidant + conductivity: confirms whether the terminal residual is drifting alongside the byproduct signal or independently.
Shanghai ChiMay’s product portfolio covers pH electrodes, ORP-capable multi-parameter sensors, online turbidity testers, and residual chlorine transmitters, all sharing a Modbus register map that lets a single SCADA screen carry the full diagnostic combination.
Trending Implementation in the Historian
A working conductivity trending implementation typically includes:
- Rolling 30-day baseline calculation with automatic outlier rejection.
- Real-time deviation flag against the amber and red thresholds documented above.
- Cross-correlation dashboard showing conductivity alongside ORP, pH, turbidity, and residual oxidant.
- Automated escalation to the laboratory queue when the amber threshold is breached for more than 60 minutes.
- Audit-ready export of the trending record to the compliance report package.
These features do not require exotic software. They are implementable on any modern SCADA historian and on most edge-computing gateways, provided the underlying analyzers report reliable, drift-managed data.
Field Lessons From Recent Deployments
Recent AOP commissioning reports emphasize a few consistent lessons:
- Conductivity trending catches byproduct events several hours before laboratory results confirm them.
- False positives typically trace to sensor coating or temperature-compensation faults, so cleaning cycles and probe diagnostics matter more than raw accuracy.
- Publishing the Modbus register map at bid stage removes days of friction from historian integration.
- Documenting the baseline during commissioning shortens the operator learning curve on trending interpretation.
Why Trending Belongs in Every AOP Design
Advanced oxidation is now the reference technology for quaternary treatment under the recast EU Urban Wastewater Treatment Directive, Directive (EU) 2024/3019 adopted in late 2024, and equivalent regulations elsewhere. Regulators, insurers, and internal auditors will increasingly ask utilities to prove not just that pollutants were destroyed, but that byproduct formation was actively monitored and managed. Conductivity trending, integrated into an AOP sensor stack, is one of the most cost-effective ways to answer that question.
For pharmaceutical, municipal, and industrial operators running ozone- or UV/H2O2-based quaternary treatment, conductivity trending should be treated as a first-order diagnostic, not as a backup measurement. Shanghai ChiMay’s in-line conductivity meter, multi-parameter sensor, and residual oxidant analyzer product families give control engineers the drift-managed, digitally integrated reference stack that makes AOP byproduct trending both feasible and audit-ready.