Table of Contents
Key Takeaways
- Non-revenue water (NRW) costs water utilities an estimated USD 39 billion per year globally — roughly 126 billion cubic meters of water, or about 30% of all water pumped, is lost to leakage, metering errors, and theft (Liemberger & Wyatt, 2019, IWA Water Supply)
- In the United States, utilities lose roughly 6 billion gallons (14–18% of treated water) every day, with about 240,000 water main breaks per year, according to the American Society of Civil Engineers (ASCE 2025 Infrastructure Report Card)
- Pressure management is among the highest-return interventions: documented field programs reduce leakage by roughly 17–26% (IWA field study, Sakarya, Türkiye; Nagpur, India case)
- Advanced metering infrastructure (AMI) recovers previously unbilled water and cuts leak detection time dramatically — one U.S. city recovered 579 million gallons (nearly USD 5 million) per year after a city-wide smart meter program (City of Toledo / Johnson Controls case study)
- Singapore’s national water agency PUB reduced unaccounted-for water from about 11% in the 1990s to around 5% today, among the world’s best rates, using sensors, pressure management, and a nationwide smart meter rollout (Inside Water, 2025)
Introduction
Water stress is spreading: more than 2 billion people live in countries facing water stress, and billions more face inadequate supply for at least part of the year (UN-Water). Meanwhile, municipal utilities lose enormous volumes of treated water — water that has already been pumped, filtered, and pressurized — through leaks, metering inaccuracies, and unauthorized consumption. Globally, NRW averages around 30% of system input, with an estimated annual value of USD 39 billion (Liemberger & Wyatt, 2019).
Smart infrastructure — smart metering, pressure management, district metered areas, and analytics — offers proven, measurable ways to reduce these losses.
Where Water Is Lost
Physical losses through leakage
Leakage is usually the largest component of NRW. The International Water Association’s water balance framework divides real losses into background leakage (seepage from joints and fittings), reported breaks, and unreported buried leaks that can run for months before surfacing. Physical losses typically account for 50–80% of total NRW in most networks (MDPI Water, 2026 review).
In the U.S., aging infrastructure drives the problem: the ASCE 2025 Report Card grades drinking water at C– and documents nearly 6 billion gallons of treated water lost daily, with about 240,000 main breaks per year (ASCE).
Apparent losses
Meter inaccuracies, data handling errors, and unauthorized consumption make up the rest. Mechanical meters under-register flow as internal parts wear — especially at the low flow rates common in residential use — gradually eroding billed revenue.
Smart Infrastructure Technologies That Reduce Loss
1. Advanced Metering Infrastructure (AMI)
Smart meters use electromagnetic or ultrasonic measurement and transmit data continuously, replacing error-prone manual reads. Beyond billing accuracy, interval data reveals leakage through anomaly detection: continuous overnight flow at a property signals a hidden leak.
The results are documented in real deployments. The City of Toledo, Ohio retrofitted or replaced more than 118,000 meters and captured an estimated 579 million gallons of previously unbilled water annually — nearly USD 5 million in additional revenue per year — while AI-powered analytics flagged leaks before they escalated (Toledo case study).
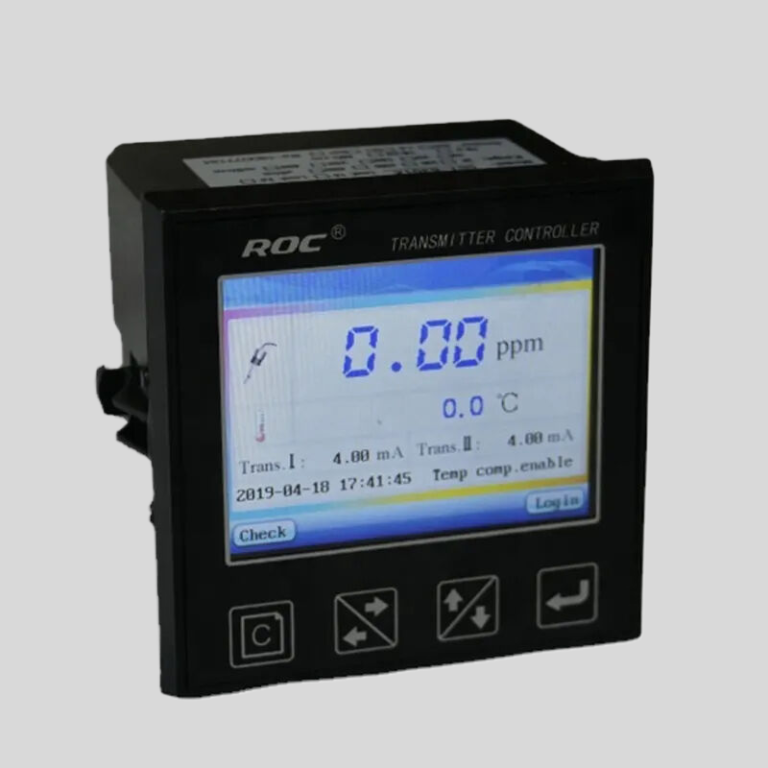
Shanghai ChiMay’s inline conductivity and flow instruments complement AMI by adding water-quality and hydraulic data that correlates with consumption patterns and infrastructure condition.
2. Pressure Management
Excess pressure accelerates leak flow and pipe stress. The relationship follows the FAVAD (Fixed and Variable Area Discharges) concept — pressure reduction reduces leakage through a power-law relationship, typically yielding leakage reductions somewhat greater than the pressure reduction itself (IWA Aqua, 2017 review).
Field evidence is strong: real-time pressure control in Sakarya, Türkiye reduced water losses by 19% over one year (Scientific Reports, 2025); optimized pressure-reducing valves in Nagpur, India cut leakage by about 20–26% seasonally (IWA Water Supply, 2018). Modulating PRVs that follow demand patterns also reduce burst frequency and extend asset life.
Shanghai ChiMay’s turbine and electromagnetic flow meters provide the flow data pressure zones need for real-time valve setpoint optimization.
3. District Metered Areas (DMA)
DMAs divide networks into discrete zones with inlet and outlet metering, enabling water balance calculations and minimum night flow (MNF) analysis — flow measured during the early-morning minimum demand window reveals hidden leakage. Analyzing 15-minute interval data lets utilities localize leaks to individual zones instead of surveying entire networks, which is why DMA-based programs consistently deliver substantial leakage reductions in their first years of operation.
4. Analytics and Machine Learning
Machine learning adds a layer beyond rule-based alarms. Peer-reviewed studies report strong detection performance on real and benchmark networks: hybrid anomaly detection models have achieved around 95% precision and 91% recall for real-time leak detection, and CNN/autoencoder models reach mid-90% accuracy on acoustic and pressure data — though most results remain from pilots and benchmark networks rather than universal operational deployment (review in ITM Web of Conferences, 2026; Transformer-based leakage detection study). Practical systems use supervised models for known leak signatures and unsupervised models (isolation forests, autoencoders) to flag novel anomalies.
What Leading Cities Have Achieved
Singapore is the most-cited national success story. PUB cut unaccounted-for water from roughly 11% in the 1990s to about 5% today through pipe replacement, leak monitoring sensors, inline inspection tools, and real-time pressure management. It has installed more than 300,000 smart meters with rollout continuing toward nationwide coverage, supported by an Integrated Operations Control Centre (Inside Water, 2025).
Toledo, Ohio demonstrates the revenue side: AMI plus analytics recovered nearly USD 5 million per year in previously unbilled water without raising rates (case study).
These programs share a pattern: metering first, then analytics, then pressure optimization, deployed in phases and integrated into daily operations.
A Practical Deployment Path
- Foundation (12–24 months) — meter key points, establish DMAs, build data collection
- Analytics (6–12 months) — MNF analysis, anomaly detection, leak alert workflows
- Optimization (12–24 months) — pressure management, predictive maintenance, control integration
- Integration — connect water data to broader city platforms and customer portals
Economic justification should be built from site-specific baselines — current NRW rate, marginal water production cost, break frequency, and meter accuracy — rather than generic ROI multipliers. Pressure management and DMA metering typically rank among the fastest-payback components.
Conclusion
The scale of avoidable loss is large and well documented: USD 39 billion per year globally, 6 billion gallons per day in the U.S. alone. The toolkit is proven — smart metering recovers revenue (as Toledo’s nearly USD 5 million annual recovery shows), pressure management cuts leakage 17–26% in documented field programs, DMAs localize hidden leaks, and machine learning is pushing detection toward mid-90% accuracy in pilot deployments. Singapore’s 5% NRW rate shows what sustained, systematic investment achieves. The technology is mature; the remaining question for most cities is deployment pace.
Sources
- Liemberger, R. & Wyatt, A. (2019) — Quantifying the global non-revenue water problem, Water Supply (IWA)
- ASCE — 2025 Infrastructure Report Card: Drinking Water
- Scientific Reports (2025) — Real-time pressure management case study, Sakarya, Türkiye
- IWA Water Supply (2018) — Leakage reduction via pressure management, Nagpur, India
- Inside Water (2025) — Smart water innovation: Singapore PUB
- Johnson Controls — City of Toledo smart metering case study