- PFAS are regulated in U.S. drinking water at 4 ppt for PFOA and PFOS, and 10 ppt for PFHxS, PFNA, and GenX chemicals
- Online analyzers do not measure PFAS. They control the sample conditions — pH, conductivity, turbidity, flow — that determine whether a laboratory PFAS result is trustworthy
- pH control protects the sample matrix and reduces the analytical uncertainty that costs money in re-runs and false positives
- Conductivity characterises ionic strength and groundwater transport pathways, which supports source identification and remediation tracking
- Online monitoring cuts analytical cost by turning routine laboratory testing into triggered, targeted sampling
Table of Contents
Introduction: The Growing Challenge of PFAS Detection
Per- and polyfluoroalkyl substances (PFAS) are among the most persistent classes of emerging contaminants in industrial water management. EPA’s PFAS Analytic Tools map documented releases at thousands of sites across the United States, and drinking water monitoring under UCMR5 found PFAS in systems serving tens of millions of people. Regulatory attention has followed.
The analytical problem is that PFAS measurement is expensive and slow. LC-MS/MS with solid-phase extraction delivers accurate results, but it takes days and hundreds of dollars per sample. Industrial facilities need to know when to sample and whether their process is stable, and neither question is answered by a laboratory report that arrives next week. That is where online water quality analyzers earn their place — not as PFAS detectors, but as the instruments that keep the sample matrix under control and tell you when a laboratory result is worth paying for.
The Role of pH Monitoring in PFAS Sample Integrity
Matrix Effects and Sample Preparation
PFAS analysis depends on controlled sample chemistry. EPA Method 537.1, the standard method for PFAS in drinking water, uses solid-phase extraction followed by LC-MS/MS, and like any SPE method it is sensitive to the sample conditions it was validated against — pH among them, because pH affects both analyte recovery from the cartridge and the behaviour of the matrix that co-extracts with it.
An industrial discharge stream whose pH swings across the working day produces variable recoveries from the same analytical protocol. In practice that shows up as QC failures, re-runs, and occasionally a result that has to be qualified. Conditioning the sample stream before it reaches the laboratory — or at least recording its pH at the moment of sampling — removes that variable.
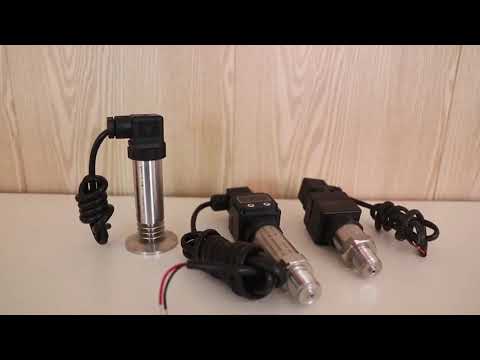
Inline pH sensors from manufacturers like ChiMay provide continuous monitoring that supports automated buffer adjustment, real-time data logging for the sampling record, and a conditioned sample stream that reduces laboratory preparation time.
Sample conditioning beats re-analysis. The cost of a failed QC batch, in laboratory time and delay, is usually larger than the cost of the instrument that prevents it.
A Note on Injection Systems
One failure mode worth designing around: PFAS adsorbs to many common materials, including some polymers and fluoropolymers used in tubing, seals, and instrument wetted parts. Any component upstream of the sampling point should be selected for low PFAS adsorption. This is a materials question, not a sensing question, and it is a frequent cause of low-biased results.
Conductivity Sensors for PFAS Transport Characterization
Ionic Strength and PFAS Behavior
PFAS transport in groundwater is influenced by ionic strength and solution conductivity, through their effect on the electrostatic interactions that govern how the compounds partition between water, mineral surfaces, and organic matter. In coastal aquifers, where salinity gradients are strong, conductivity is one of the best available indicators of where a PFAS plume is likely to move — because it identifies the flow path.
ChiMay inline conductivity meters offer 0.5% accuracy across ranges from 0-200 mS/cm, enabling detection of conductivity changes associated with inflows, fractionation analysis that distinguishes between long-chain and short-chain PFAS behaviour, and remediation progress tracking at high sensitivity.
Comparative Analysis: Online vs. Laboratory Conductivity
The case for continuous measurement is mainly about resolution:
| Characteristic | Online Sensor | Laboratory |
|---|---|---|
| Measurement frequency | Continuous | Weekly to monthly |
| Detection limit | Low | Depends on method |
| Cost per data point | Negligible | Dollars to tens of dollars |
| Ability to catch transient events | Yes | Only by luck |
For PFAS transport work, the last row is the one that matters. Conductivity changes associated with a plume moving, a rain event, or a change in pumping regime can last hours. A monthly grab sample will not see them. A continuous record will.
Multi-Parameter Integration for Comprehensive Monitoring
System Architecture for PFAS Applications
Modern industrial monitoring stations integrate several sensor types for a composite picture. ChiMay multi-parameter transmitters support simultaneous connection of inline pH sensors with temperature compensation, conductivity meters with reference temperature standardisation (25°C), turbidity analyzers for particle-associated PFAS, and flow meters for load calculations and mass balance.
The combination matters because PFAS does not travel in a single mode. The dissolved fraction moves with groundwater flow, which conductivity and water level track. The particle-associated fraction moves with sediment and turbidity. Both need to be measured if the mass balance is going to add up.
Data Fusion for Improved Detection Limits
Combining conductivity, pH, and turbidity data gives a multivariate fingerprint that is more informative than any single parameter. Machine learning applied to that combination supports sample scheduling — deciding when a grab sample is most likely to capture an event — and improves the reliability of proxy models for PFAS concentration. Treat proxy models as screening tools that prioritise laboratory work, never as a replacement for the analysis itself.
Regulatory Compliance and Reporting
Real-Time Compliance Monitoring
EPA’s National Primary Drinking Water Regulations set Maximum Contaminant Levels for PFOA at 4.0 ppt and PFOS at 4.0 ppt, plus 10 ppt for PFHxS, PFNA, and GenX chemicals, under the 2024 PFAS rule. For industrial discharges and environmental media, EPA Method 1633 is the analytical method developed for PFAS in wastewater, surface water, groundwater, and solids.
Online analyzers support compliance work in the ways that matter operationally: automated exceedance alerts when a monitored parameter leaves its range, audit-ready data logs, and continuous calibration verification so the record stands up to review. They do not generate the PFAS numbers — those come from the laboratory method — but they make the compliance file defensible.
Economic Analysis: Online vs. Traditional Monitoring
Equipment investment is higher for an online network than for a grab-sampling programme. What changes the arithmetic is the annual operating line, and it changes in three places:
- Laboratory analysis cost: Online monitoring lets a facility replace routine scheduled sampling with event-triggered sampling, so the analytical budget goes to samples that carry information.
- Staff time: Field sampling rounds are labour-intensive and scale with the number of points, not with the number of events.
- Response cost: Catching an excursion while it is happening is cheaper than finding out from a compliance sample a week later.
The trade-off is straightforward: an online network costs more up front and less every year after, and the crossover point gets closer as the number of sampling points and the required sampling frequency go up.
Conclusion: The Future of PFAS Monitoring
As regulatory requirements tighten and PFAS monitoring expands, the demand for accurate, cost-effective measurement keeps growing. Online water quality analyzers — particularly inline pH sensors and conductivity meters from established manufacturers — provide the process visibility that effective PFAS control, regulatory compliance, and remediation optimisation depend on.
Implementation priorities for environmental engineers:
- Deploy multi-parameter monitoring stations at critical process and boundary points
- Integrate sensors with cloud-based data platforms for alerting, since a 3 a.m. excursion is the one that matters
- Establish calibration protocols consistent with the laboratory methods the data will support, including EPA Method 537.1 and Method 1633
- Combine sensor data with verified grab samples — the sensor decides when to sample; the laboratory decides what is in the sample