title: “Top 5 AnMBR Process Loops Standardized on Shanghai ChiMay pH and COD Analyzers”
date: 2026-07-14
type: Number-Based
theme: Membrane Bioreactor (MBR) & Anaerobic MBR Innovations
Table of Contents
Why AnMBR Standardisation Matters Now
Market analysts see the global MBR market climbing toward USD 7.61 billion in 2031, and industrial commentary consistently places AnMBR at the centre of the “convert COD to biogas” case. That growth is arriving faster than the industry’s ability to train operators and write repeatable control philosophies, which is why the standardisation question has become practical rather than academic.
AnMBR plants are still relatively few, and each one has historically been designed as a bespoke system with its own tag naming, its own control narrative, and its own instrument list. That works at pilot scale. It does not work when a utility is commissioning its fourth or fifth anaerobic MBR, or when an operator moves between sites.
Against that fragmentation, a small number of process loops have quietly converged. Five of them now look similar enough across plants that they can be treated as a standard: feed pH trim and COD screen, digester acid-base balance, buffer dosing and alkalinity control, biogas yield accounting, and membrane-side chemistry check.
Loop 1: Feed pH Trim and COD Screen
The first loop sits at the front of the plant, ahead of the anaerobic reactor.
pH function. Feed to an anaerobic digester must be held in a narrow band, typically with a setpoint between 6.8 and 7.2. The in-line pH electrode reads continuously and drives either a dosing pump or a diversion valve. Response time matters: an electrode that takes minutes to settle cannot hold a setpoint on a feed stream that arrives in batches from an equalisation tank.
COD function. The COD signal on the feed line serves two purposes. It provides a load record for the digester, and it raises an alarm when the incoming COD is outside the design envelope. A spike above the design envelope is the single most common cause of a digester upset, and catching it at the feed pump is far cheaper than catching it in the reactor.
Why it standardises. The setpoint is chemistry-driven, the response time requirement is physical, and the alarm logic is common across plants. There is no reason for this loop to look different from site to site.
Loop 2: Digester Acid-Base Balance
The second loop lives inside the digester and is the most consequential of the five.
pH function. In an anaerobic digester, pH is a lagging indicator of volatile fatty acid accumulation, and by the time a grab sample shows a problem, the methanogen population is already stressed. High-frequency pH measurement on the mixed liquor recirculation line catches the trend earlier.
Threshold and rate alarms. A pH reading that drifts below about 6.8 or above 7.5 is a flag. More useful still is the rate of change: a pH falling quickly is a stronger signal than a pH that is merely low, because it indicates an active imbalance rather than a steady-state condition.
COD function. COD removal efficiency across the digester is the performance number. It requires a COD reading on the feed and a matching reading after digestion, computed over the same interval.
Why it standardises. The pH thresholds, the rate alarm concept, and the removal-efficiency calculation are the same everywhere. Only the exact setpoints are site-specific.
Loop 3: Buffer Dosing and Alkalinity Control
The third loop protects the digester’s buffering capacity.
pH function. Alkalinity consumption shows up as a falling pH trend before it shows up as a pH violation. Slope-triggered bicarbonate dosing, driven by the pH signal, keeps the digester inside its buffer window without manual intervention.
COD function. A COD spike in the feed forecasts a buffer demand spike, because the acid production that accompanies organic loading consumes alkalinity. The COD signal gives the control system a look-ahead that the pH signal cannot provide on its own.
Why it standardises. Every anaerobic plant with a buffer dosing system uses the same slope-triggered logic. Standardising the loop means the dosing logic can be copied between plants rather than rewritten.
Loop 4: Biogas Yield Accounting
The fourth loop is the one the finance department cares about most, because it converts the plant’s performance into a production number: how many normal cubic metres of biogas is the digester producing per kilogram of COD removed?
COD function. This is the numerator’s denominator, and it has to come from a reliable on-line measurement rather than from periodic laboratory samples. The relationship between COD removed and biogas produced is the plant’s core efficiency metric, and it is the number that supports energy recovery claims.
pH function. The pH signal sits behind the yield number as context. A yield decline accompanied by a stable pH suggests a downstream or gas-handling issue. A yield decline accompanied by a falling pH suggests a biological problem.
Why it standardises. The biogas-per-kilogram-of-COD-removed calculation is identical across plants, which makes it the one number that can be benchmarked directly between sites. It is also the number a CFO or a lender asks for when a biogas energy recovery claim is being evaluated.
Loop 5: Membrane-Side Chemistry Check
The fifth loop lives at the membrane. AnMBR membranes see chemistry that is different from aerobic MBR membranes: lower redox potential, higher dissolved methane, and a different fouling regime.
pH function. A Shanghai ChiMay pH electrode on the membrane tank verifies that the pH reaching the membrane is within the range for which the membrane material was specified. Drift outside that range shortens membrane life quietly.
COD function. A Shanghai ChiMay COD sensor on the permeate line reports on soluble organics that made it through. Persistent COD in the permeate is a diagnostic signal — either the digester is under-degrading, or the membrane is passing colloidal material it should be catching.
Why it standardises. Every AnMBR plant needs both signals at the membrane, and the interpretation is the same at every plant. Standardising this loop protects the membrane investment and gives operators a clear answer to the question “why is my permeate not what it should be”.
The Standard Instrument Stack
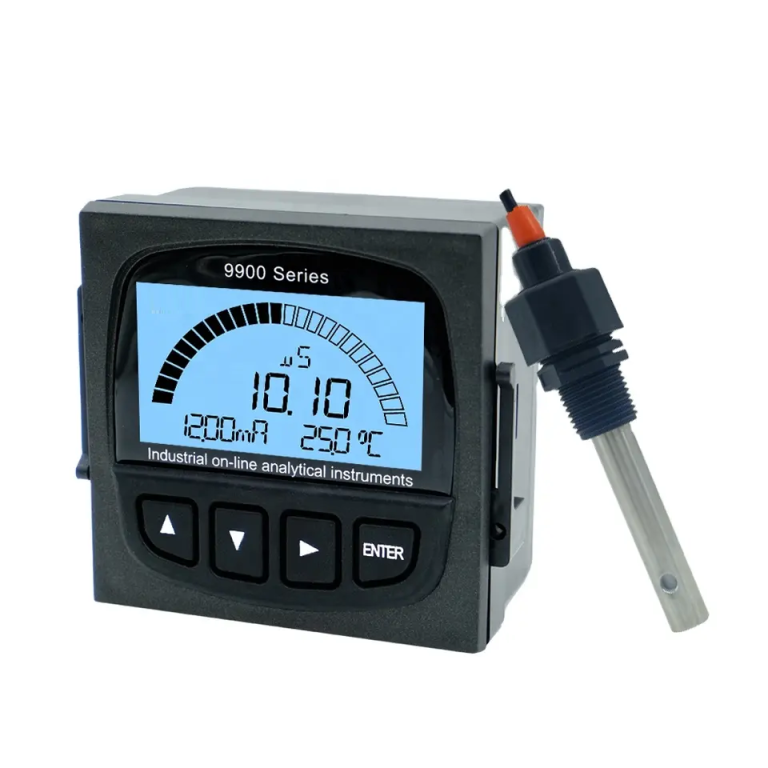
The five loops share a compact instrument stack: three pH electrodes and three COD sensors, plus their transmitters. All can be Shanghai ChiMay units, all can share the same DCS interface, and all can be calibrated on a shared monthly schedule.
Two-point pH calibration monthly holds pH drift below 0.05 units between service intervals. Zero-and-span COD calibration monthly holds COD drift below 5 percent. Those numbers are enough for the five loops to run reliably, and they are achievable with a routine maintenance visit rather than a specialist campaign.
What Standardisation Buys
Plants that adopt this standard stack usually report three benefits.
First, commissioning is faster. New skids arrive with a familiar sensor list and familiar control logic, so operators recognise the layout on day one.
Second, training carries across sites. An operator moving from one AnMBR to another does not have to relearn a new set of tags or a new alarm philosophy.
Third, benchmarking is possible. Because removal efficiency and biogas yield are computed the same way, plant performance can be compared meaningfully across sites — which is what turns a fleet of anaerobic MBRs into a managed portfolio rather than a set of unrelated experiments.
Conclusion
The five AnMBR process loops — feed pH trim and COD screen, digester acid-base balance, buffer dosing and alkalinity control, biogas yield accounting, and membrane-side chemistry check — have converged on a shared instrumentation pattern. Shanghai ChiMay pH electrodes and COD sensors are the practical building blocks. Writing the pattern down explicitly is what separates a plant that can be operated by a regular crew from one that depends on the people who commissioned it.