Microplastics are in drinking water, in bottled water, in rain and in air. The evidence for exposure is now solid. The evidence for harm at the concentrations found in drinking water is not, and anyone who tells you otherwise is filling a gap in the data with a conclusion. This article sets out what is established, what is still open, and what you can reasonably do.
Table of Contents
What Microplastics Are
Microplastics are plastic particles below 5 mm. Nanoplastics are usually defined as particles below 1 µm (1,000 nm).
Primary microplastics are manufactured at that size — cosmetic microbeads, industrial abrasives, plastic production pellets, some pharmaceutical carriers.
Secondary microplastics come from the breakdown of larger items: tyre wear, synthetic textile fibres, bottle and packaging fragmentation, fishing gear.
Size categories in general use:
- Macroplastics: above 5 mm
- Large microplastics: 1–5 mm
- Small microplastics: 1 µm – 1 mm (subdivided for reporting purposes)
- Nanoplastics: below 1 µm
The distinction matters because sampling and analysis methods differ by size range, and most routine monitoring does not see nanoplastics at all. Studies reporting “microplastics” in water are usually reporting particles larger than roughly 10–20 µm, because that is what the standard instrument (FTIR imaging) can identify. This is the single most important caveat when comparing reported concentrations: methods with different lower size limits produce numbers that differ by orders of magnitude.
How They Get Into Water
Wastewater is the main pathway. Synthetic textiles shed fibres in every wash. Studies of individual garments have reported figures from a few hundred to several hundred thousand fibres released per wash, with the result depending on fabric type, detergent, temperature, machine type and whether a filter or wash bag is used. Those fibres enter the sewer, and the treatment plant is the barrier that has to catch them.
Conventional wastewater treatment removes most microplastics by mass, particularly where tertiary filtration or a membrane stage is present. Removal efficiency reported in the literature is generally very high for the larger size fractions that current methods can measure, with the residual fraction discharged to receiving water. The uncomfortable part is that the removal figures get worse as particle size falls, and the smallest fraction is both the least measured and the most likely to cross biological barriers.
Drinking water sources then receive that residual load, along with atmospheric deposition and runoff.
Treatment performance by particle size
What can be said with confidence about drinking water treatment:
- Coagulation, flocculation and sedimentation remove a large fraction of larger particles efficiently; performance falls off as particle size decreases, and the low-density, fibre-shaped particles behave differently from mineral particles of the same size.
- Granular media and sand filtration is effective for particles in the tens of micrometres and above, and much less so for particles below that.
- Membrane filtration is the reliable barrier: MF and UF remove essentially all particles above their pore size, and RO removes essentially everything in the particulate range. This is why membrane-based potable plants report the lowest microplastic concentrations in product water.
- Chlorination does not remove particles; it is also a reminder that a mature distribution system contributes its own plastic debris.
The practical conclusion for a water utility is not that conventional plants fail, but that the barrier performance is size-dependent and that monitoring programmes describe a specific size window.
What the Exposure Data Shows
- Tap water: a widely cited 2017 survey (Orb Media, with researchers at the University of Minnesota and SUNY) found plastic fibres in a large majority of tap water samples tested worldwide, including around 94% of samples from the United States. That study used the methods of the time; later work in specific countries has found different rates, generally with better analytical methods and different detection limits.
- Bottled water: a 2024 study published in PNAS applied laser-based imaging to bottled water and reported average particle counts in the tens of thousands per litre, with a large majority in the nanoplastic size range. As with all counting studies, the number depends heavily on the lower size and the polymer identification requirement.
- Ingestion estimates: the frequently quoted “five grams per week, a credit card’s worth” comes from a 2019 WWF-commissioned review (University of Newcastle) that aggregated food, water and air pathways. Estimates from different groups range enormously — more than an order of magnitude — because they depend on particle size cut-offs, detection methods and assumptions about food. Treat the credit-card comparison as communication, not as a measurement.
- Human tissue: a 2022 study in Environment International detected plastic particles in the blood of a majority of the small number of donors tested (17 of 22), and a 2021 study reported microplastics in placental tissue from a very small sample. These are important findings in the sense that they show the particles are not confined to the gut, but the sample sizes are tiny and the identification methods limited. They are pointers for research, not risk estimates.
What the Health Evidence Does and Doesn’t Show
WHO’s position (Microplastics in drinking-water, 2019) is the most balanced summary available: based on the evidence to date, the risks to human health from microplastics in drinking water appear low at current concentrations, but the data are insufficient for a definitive risk assessment, and the main recommendation was to address the larger, well-established water quality problems first.
Mechanisms under investigation:
- Physical effects: particle-induced inflammation at tissue surfaces; whether particles below roughly 10 µm translocate across the intestinal epithelium in humans is still being characterised.
- Chemical leaching: plastics contain additives, and the particles themselves can carry adsorbed pollutants. The key question is dose — the mass transferred from the particles ingested via drinking water is very small relative to other exposure routes, and additive transfer from food-contact materials is a separate and better-characterised issue.
- Microbial colonisation: plastics provide surfaces for biofilm formation, including potentially on pathogens. Whether this represents a meaningful transmission route in drinking water is an open question and is not the same as the much better established role of plumbing biofilm in general.
- Immune and developmental effects: studied in animals and cell models with mixed results; extrapolation to human drinking water exposure is not straightforward.
Two framing points are worth keeping in mind. Nanoparticles taken up by the body are cleared by the same mechanisms as other particulates, and the toxicological literature on engineered nanoparticles is a large part of the basis for concern. And the exposure route with the greatest uncertainty is not the water that leaves the treatment plant but the bottles and pipes it passes through afterwards.
What Sensors Can and Cannot Tell You
Turbidity responds to suspended particles and is the cheapest available screening measurement. It cannot distinguish plastic from mineral or organic particles, and nanoplastics contribute almost nothing to it. What turbidity is genuinely good for is detecting events — a storm, a raw water change, a treatment upset — that carry elevated particle loads, and for triggering sampling.
Particle counters give a size distribution and can be trended for changes in the particle load. They are useful for filtration performance monitoring and not useful for identifying plastics.
Identification requires laboratory methods:
- FTIR microscopy (including imaging) is the workhorse: it identifies polymer type particle by particle, with a practical lower size limit typically around 10–20 µm for routine imaging.
- Raman microscopy reaches smaller particles (approaching 1 µm in favourable cases) at the cost of longer analysis times and greater sensitivity to fluorescence interference.
- Pyrolysis GC/MS gives a mass-based result rather than a particle count, which is a genuinely different measurement and not directly comparable with counting studies.
Sample handling — filtration, digestion of organic matter, contamination control from clothing and lab plastics — determines the result as much as the instrument does. Cross-study comparison is difficult for exactly this reason, and any vendor offering “microplastic measurement” from a turbidity sensor should be treated as offering a screening indicator, not a measurement.
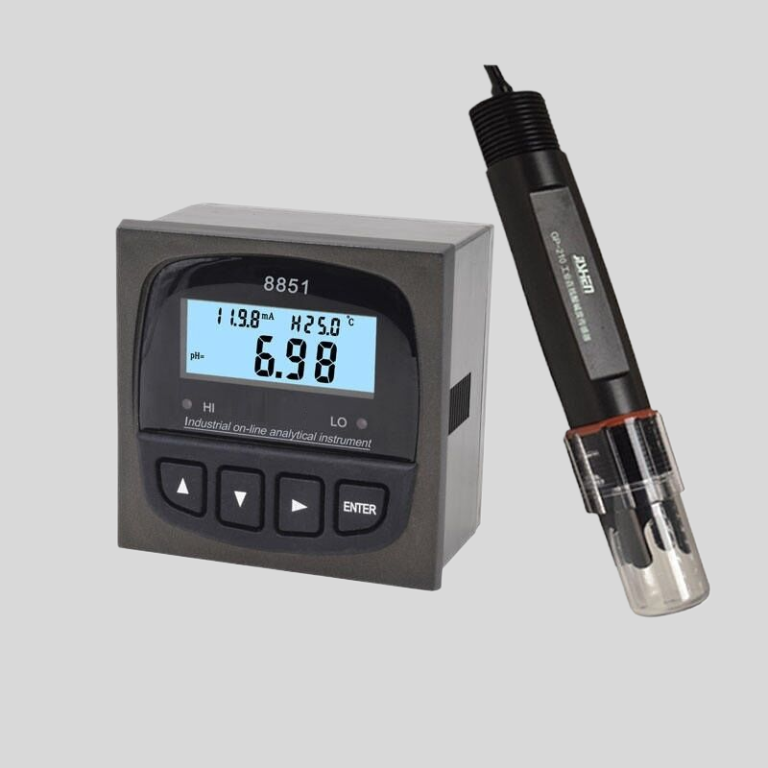
ChiMay’s position on this is the honest one: inline turbidity and particle monitoring provide the event detection and baseline data that tells a utility when to send a sample for laboratory analysis. They do not quantify microplastics, and no optical sensor on the market does.
Reducing Exposure
For a household, the options in descending order of effectiveness:
- Point-of-use RO removes essentially all particles in the microplastic range; it is the most effective consumer option, at the cost of water rejection and maintenance.
- Ceramic or tight microfiltration cartridges remove the great majority of particles above their pore size and are effective for the sampled size range.
- Activated carbon filters reduce some microplastics and are primarily there for taste, odour and chlorine removal; their particulate removal depends on the media and the housing seal, not on the carbon itself.
- Glass and stainless steel containers, and avoiding heating food in plastic, reduce exposure from food-contact sources that are outside the water system entirely.
- Laundry practice (full loads, lower temperatures, a fibre filter or wash bag, front-loading machines) reduces the load the wastewater system has to treat — the measure with the largest effect at the source.
Wrapping up
The established facts are that microplastics are present in drinking water, that treatment removes most of the larger particles but is size-dependent, and that nanoscale particles are largely unmeasured in routine monitoring. The open questions are whether the concentrations present in drinking water cause harm, and at which particle size, polymer type and dose that would matter. WHO’s assessment — low apparent risk with significant data gaps — remains the best summary of the evidence.
For utilities, that argues for measuring what can be measured well: continuous turbidity and particle data, with laboratory identification used where a result has to be defensible. For everyone else, the practical measures are source reduction and a filter that actually removes particles, in that order.