Corrosion-related failures remain one of the largest controllable sources of unplanned downtime in chemical processing. Cooling towers, heat exchangers, and boiler feedwater systems all concentrate the conditions that drive corrosion, and water management is where most of those conditions can be caught and corrected. This article outlines a practical water management program for reducing corrosion-related shutdowns, from monitoring architecture to predictive maintenance and cost justification.
Table of Contents
The Cost of Unplanned Shutdowns
Direct and Indirect Cost Components
Chemical plant shutdowns triggered by corrosion-related failures generate costs far exceeding simple repair expenses. The ranges below are illustrative planning figures that vary widely with plant size, product mix, and contract terms:
Direct Costs:
| Cost Category | Typical Range | Notes |
|—————|—————|——-|
| Equipment repair | $25,000-500,000 | Varies with equipment complexity |
| Replacement parts | $10,000-200,000 | Often require expedited sourcing |
| Maintenance labor | $15,000-150,000 | Overtime often required |
| Environmental cleanup | $20,000-100,000 | Spill containment and remediation |
| Regulatory reporting | $5,000-25,000 | Compliance documentation |
Indirect Costs:
| Cost Category | Typical Impact | Notes |
|—————|—————|——-|
| Production loss | $50,000-300,000/day | Highly facility-dependent |
| Customer penalties | $25,000-500,000 | Contractual penalties |
| Market opportunity cost | Variable | Lost sales and market share |
| Workforce disruption | $10,000-50,000 | Shift adjustments, morale impact |
| Reputation damage | Long-term | Customer confidence erosion |
Total Shutdown Cost: An unplanned shutdown lasting a couple of days can plausibly run from hundreds of thousands to several million dollars depending on facility size and product mix. The indirect categories usually dominate, which is why the case for continuous water monitoring rests on avoided production loss rather than avoided repair bills.
Root Cause Analysis
Post-incident reviews of corrosion-related shutdowns tend to surface a consistent pattern rather than a precise statistical distribution: inadequate monitoring is the most common contributor, followed by slow treatment response and equipment specification errors. Changes in operating conditions and purely unknown causes account for the remainder. The practical takeaway is that most of the contributing factors are visible in water chemistry data well before they become shutdown events.
Earlier detection through continuous monitoring addresses the largest category directly — corrosion excursions almost always show up in pH, conductivity, chloride, or corrosion-rate trends first.
Water Management Program Components
Comprehensive Monitoring Framework
Effective water management begins with understanding water chemistry throughout the facility:
Tier 1 – Critical Equipment Monitoring:
– Heat exchangers
– Cooling towers
– Boiler feedwater systems
– Process water heaters
– Critical piping circuits
Tier 2 – System Balance Monitoring:
– Makeup water quality
– Treatment system performance
– Distribution system conditions
– Process return water quality
Tier 3 – Compliance Monitoring:
– Discharge water quality
– Environmental permit parameters
– Occupational safety limits
Key Parameters by System Type
Cooling Water Systems:
| Parameter | Target Range | Action Level | Critical Level |
|———–|————-|————-|—————|
| pH | 7.0-8.0 | 6.5-7.0 or 8.0-8.5 | < 6.5 or > 8.5 |
| Conductivity | < 3,000 μS/cm | 3,000-5,000 μS/cm | > 5,000 μS/cm |
| Chlorides | < 300 ppm | 300-600 ppm | > 600 ppm |
| Hardness | < 500 ppm | 500-1,000 ppm | > 1,000 ppm |
| Corrosion rate | < 2 mpy | 2-5 mpy | > 5 mpy |
Process Water Systems:
| Parameter | Target | Monitoring Frequency |
|———–|——–|———————|
| pH | Process-specific | Continuous |
| Corrosivity index | Non-corrosive | Continuous |
| Dissolved oxygen | < 0.1 ppm | Continuous |
| Chlorides | Minimized | Continuous |
| Turbidity | < 5 NTU | Continuous |
Online Monitoring Implementation
Instrumentation Selection
Modern online instrumentation provides the foundation for proactive water management:
Essential Instruments:
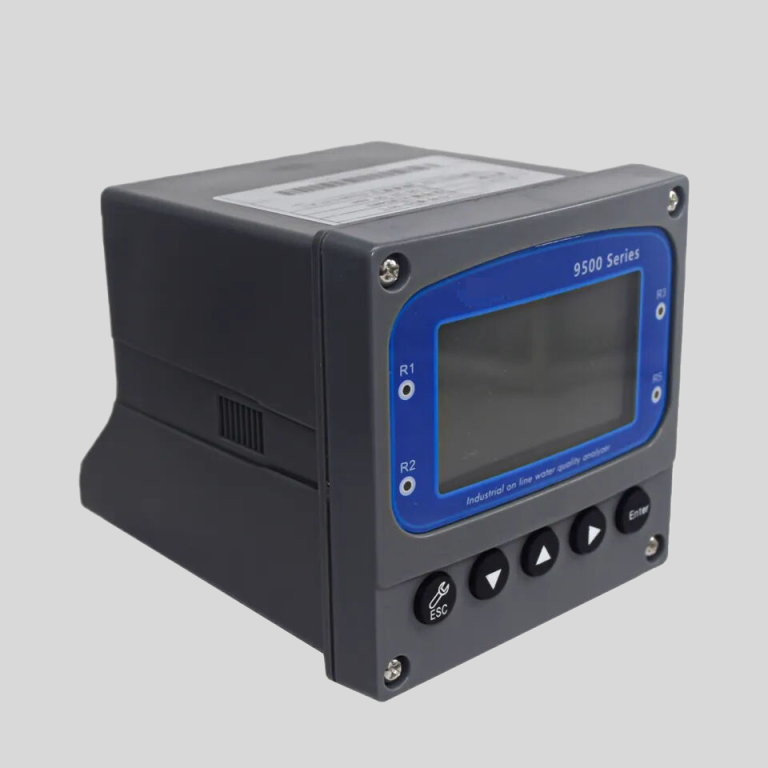
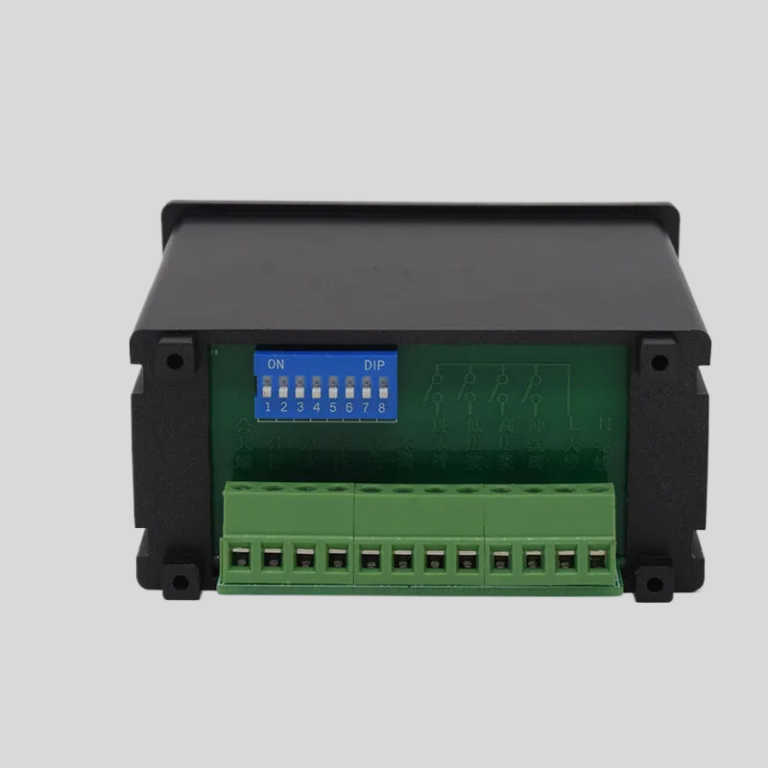
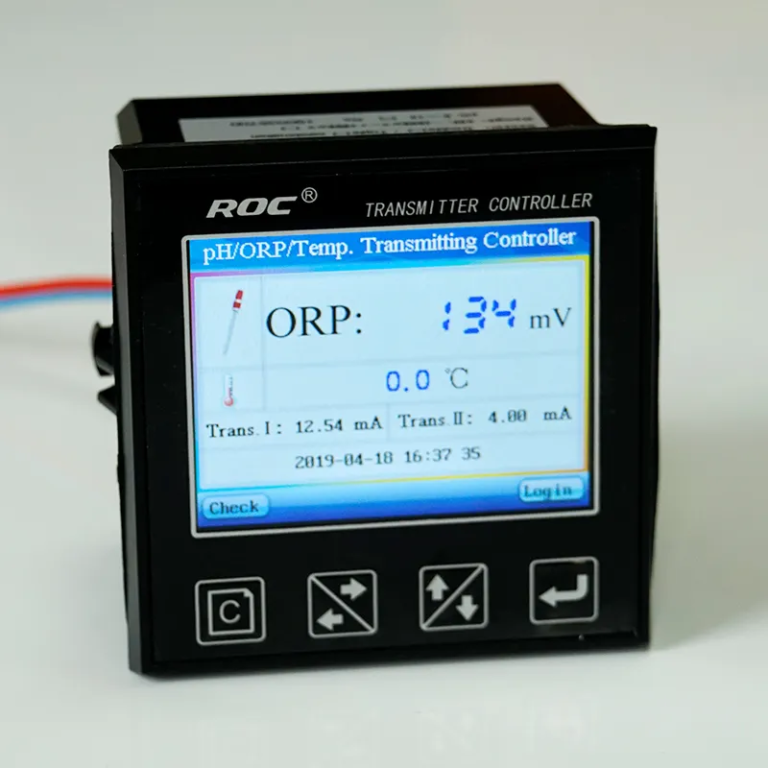
1. Multi-parameter transmitters: Central data collection and control interface
2. pH sensors: Continuous acid/base condition monitoring
3. Conductivity sensors: Ionic content and concentration monitoring
4. Corrosion probes: Direct rate measurement
5. Dissolved oxygen transmitters: Aeration and corrosion monitoring
6. Turbidity sensors: Particulate and biofilm monitoring
Advanced Instruments:
– Chloride ion-selective electrodes
– ORP sensors for biocide effectiveness
– ATP monitors for biofilm monitoring
– Particle counters for suspended solids trending
System Integration Architecture
| Layer | Components | Function |
|---|---|---|
| Field instruments | Sensors, probes, analyzers | Primary measurement |
| Transmitters | Signal conditioning, conversion | Data aggregation |
| Controller | PLC, DCS input modules | Local control logic |
| SCADA/HMI | Operator interface, trending | Process visualization |
| Historian | Data storage, reporting | Performance analysis |
| CMMS | Work order management | Maintenance execution |
Shanghai ChiMay’s integrated monitoring platforms support data flow from field instruments through plant control systems, with native support for HART, Modbus TCP/RTU, Foundation Fieldbus, and Profibus PA protocols.
Alert Configuration Strategy
Effective alerting balances responsiveness against alarm fatigue:
Three-Tier Alert Structure:
| Alert Level | Trigger Condition | Response Requirement | Notification |
|---|---|---|---|
| Advisory | 75% of action limit | Review within 48 hours | Daily summary |
| Warning | Action limit reached | Response within 4 hours | Shift supervisor |
| Critical | 90% of critical limit | Immediate response | Plant manager |
Alert Deadband: Configure 5-10% deadband on all alarms to prevent cycling near threshold values.
Predictive Maintenance Integration
Corrosion Rate Trend Analysis
Continuous corrosion monitoring enables trend-based maintenance scheduling:
Trend Indicators:
– Rate increase > 20% over 7 days
– Rate exceeds 50% of action limit
– Rate approaching action limit with accelerating slope
– Comparison to seasonal baseline exceeds ±30%
Remaining Life Calculations
Predictive algorithms estimate equipment remaining useful life:
Calculation Factors:
– Current corrosion rate
– Equipment wall thickness (UT measurements)
– Design minimum wall thickness
– Rate acceleration/deceleration trend
– Operating schedule projections
Example Calculation:
– Current wall thickness: 8.5 mm
– Design minimum: 4.0 mm
– Current corrosion rate: 0.8 mm/year
– Remaining life: (8.5 – 4.0) / 0.8 = 5.6 years
– Recommended inspection: Within 18 months
Economic Performance Metrics
Benchmarking Framework
Facilities that run water management programs well typically track a small set of operational KPIs. Absolute benchmark values vary widely by industry segment, so the numbers below are illustrative rather than published industry averages:
| KPI | Typical Program | Strong Program |
|---|---|---|
| Corrosion-related shutdowns/year | 1-2 | < 0.5 |
| Unplanned downtime hours/year | ~100 | < 30 |
| Monitoring alarms false positive rate | ~30% | < 15% |
| Equipment replacement at design life | Common | Frequently deferred by condition |
ROI Calculation (Illustrative)
Water Management Program Investment (order-of-magnitude planning figures):
– Online instrumentation: $150,000-300,000
– Control system upgrades: $50,000-100,000
– Training and implementation: $25,000-50,000
– Annual maintenance: $20,000-40,000
Expected Benefits (typical mid-size facility):
– Avoided production loss from one prevented shutdown event per year or more, which alone can exceed the full instrumentation investment
– Efficiency improvement: a few percent of energy savings from cleaner heat transfer surfaces
– Treatment optimization: double-digit percentage chemical reduction from feedback-controlled dosing
– Equipment life extension: deferred early replacement of exchangers and piping
The investment case is usually dominated by avoided downtime, which is why facilities with the most expensive production loss justify monitoring programs fastest.
Case Study (Illustrative Composite)
The following composite example, drawn from typical outcomes reported across specialty chemical operations, shows the mechanics of a program rollout rather than a single documented facility:
Initial Performance:
– Recurrent corrosion-related downtime measured in hundreds of hours per year
– Production losses and maintenance costs each in the mid six figures annually
Implementation Actions:
1. Installed online corrosion monitoring at critical points
2. Implemented automated treatment control based on sensor feedback
3. Established predictive maintenance triggers based on trend analysis
4. Retrained operations and maintenance personnel
Results Over Several Years:
– Corrosion-related downtime reduced by an order of magnitude
– Maintenance spending re-shifted from emergency response to planned work
Conclusion
Effective water management programs represent proven investments for chemical processing facilities seeking to reduce corrosion-related downtime. The combination of comprehensive online monitoring, automated control systems, and predictive maintenance integration enables step-change improvements in operational reliability.
Shanghai ChiMay provides comprehensive water monitoring solutions designed specifically for chemical processing applications, with instrumentation rated for aggressive environments and control systems that integrate with existing plant infrastructure.