Table of Contents
Microbial Challenge Overview
Microbial growth in cooling water systems presents dual threats: reduced heat transfer efficiency from biofilm accumulation and accelerated corrosion through microbial-induced corrosion mechanisms. Industry estimates put biofilm-related losses—energy, cleaning, and equipment damage—at a heavy and recurring cost for facilities that leave microbial growth uncontrolled.
Introduction
Industrial cooling water systems offer ideal conditions for microbial proliferation: warm temperatures (25-45°C), abundant nutrients, large surface areas for attachment, and protection from environmental fluctuations. Once biofilms establish on heat exchanger surfaces, they create persistent problems that batch biocide treatments struggle to control.
Modern sensor-based strategies shift the approach from reactive treatment to predictive control, enabling intervention before biofilm problems escalate. This article examines biofilm formation mechanisms, monitoring technologies, and sensor-driven control strategies for cooling water systems.
Biofilm Formation Dynamics
Developmental Stages
Biofilm formation follows a predictable sequence:
Stage 1: Initial Attachment (0-24 hours)
– Free-floating bacteria (planktonic) encounter surfaces
– Reversible attachment via weak physicochemical interactions
– Pseudomonas aeruginosa can attach within 15-30 minutes under favorable conditions
Stage 2: Irreversible Attachment (24-72 hours)
– Bacteria produce extracellular polymeric substances (EPS)
– Van der Waals and electrostatic forces strengthen attachment
– Division begins, forming microcolonies
Stage 3: Maturation I (3-7 days)
– EPS matrix fully develops, creating a protective barrier
– Bacterial population reaches 10⁶-10⁸ CFU/cm²
– Channels develop for nutrient and waste transport
Stage 4: Maturation II (7-14 days)
– Biofilm reaches full thickness (10-100 μm typical)
– Maximum protection against biocides and hydrodynamic shear
– Metabolic activity varies across biofilm depth
Stage 5: Dispersion (Continuous)
– Bacteria detach and return to the planktonic state
– Colonization of new surfaces follows
– Contamination spreads through the system
Species Composition
Cooling water biofilms typically contain multiple microbial populations:
| Microbial Type | Prevalence | Primary Concerns |
|---|---|---|
| Bacteria (heterotrophic) | 60-80% | Slime formation, corrosion |
| Sulfate-reducing bacteria (SRB) | 5-15% | Hydrogen sulfide, pitting corrosion |
| Iron-oxidizing bacteria | 5-10% | Iron deposits, under-deposit corrosion |
| Algae | 10-20% | Chlorophyll interference, debris |
| Protozoa | 2-5% | Nutrient recycling |
Sensor Technologies for Biofilm Monitoring
Online Biomass Sensors
Adenosine Triphosphate (ATP) Analysis:
ATP monitoring provides real-time quantification of viable microorganisms:
- Measurement range: 1-100,000 RLU
- Response time: 5-10 minutes
- Detection limit: 10³ CFU/mL
- Sample requirement: 10-50 mL
Vendor guidance for cooling water applications commonly treats ATP readings in the low hundreds of RLU as elevated and higher readings as indicating problematic biofilm development—calibrate the thresholds against your own baseline rather than adopting generic numbers.
Turbidity Monitoring
Biofilm formation increases water turbidity through cell accumulation and EPS release:
| Turbidity Level | Interpretation | Biofilm Status |
|---|---|---|
| < 10 NTU | Clean | Minimal biofilm |
| 10-25 NTU | Moderate | Developing biofilm |
| 25-50 NTU | Elevated | Active biofilm growth |
| > 50 NTU | High | Established biofilm |
Shanghai ChiMay’s turbidity sensors utilize nephelometric measurement with 90° scattered light detection, achieving accuracy of ±2% of reading across the range of 0-1000 NTU. The sensors incorporate automatic bubble elimination and wiper systems that hold calibration for 12+ months.
Electrochemical Impedance Spectroscopy (EIS)
EIS monitoring detects biofilm formation by measuring changes in electrode impedance:
- Detects biofilm presence: 24-48 hours before visual confirmation
- Quantifies biofilm thickness: 0.1-500 μm range
- Differentiates biofilm from mineral deposits
- Provides continuous monitoring capability
Correlation Data: Published studies report strong agreement between EIS measurements and ATP data, close enough to cross-validate biofilm status between methods.
Biofouling Monitors
Dedicated biofilm monitoring coupons combined with visual inspection or mass measurement:
- Direct observation of biofilm accumulation
- Quantification of biomass per unit area
- Assessment of biofilm structure and composition
- Validation of treatment program effectiveness
Sensor-Based Control Strategies
Continuous Monitoring Approach
Traditional biocide treatment follows fixed schedules regardless of actual microbial loads. Sensor-driven approaches adapt treatment to biological conditions:
Traditional Program:
– Shock biocide dosing: 2-3 times per week
– Residual maintenance: Continuous low-level dosing
– Adjustment frequency: Monthly based on trends
Sensor-Driven Program:
– Continuous ATP/turbidity monitoring
– Trigger-based biocide dosing when thresholds exceeded
– Optimized residual maintenance based on sensor data
– Adjustment frequency: Real-time as conditions change
Threshold Configuration
Effective sensor-based control requires appropriate threshold settings:
| Parameter | Warning Threshold | Action Threshold | Critical Threshold |
|---|---|---|---|
| ATP | 100 RLU | 500 RLU | 1,000 RLU |
| Turbidity | 15 NTU | 30 NTU | 50 NTU |
| SRB | 10³ CFU/mL | 10⁴ CFU/mL | 10⁵ CFU/mL |
| Heterotrophic plate count | 10⁴ CFU/mL | 10⁵ CFU/mL | 10⁶ CFU/mL |
Automated Response Logic
Modern control systems implement multi-level response algorithms:
Level 1 – Enhanced Monitoring:
– Trigger: Warning threshold exceeded
– Action: Increase monitoring frequency to hourly
– Notification: Operations personnel alerted
Level 2 – Intervention Dosing:
– Trigger: Action threshold exceeded
– Action: Automated biocide dose based on sensor value
– Duration: Continues until sensor values drop below threshold
Level 3 – System Treatment:
– Trigger: Critical threshold exceeded
– Action: Maximum biocide dosing, possible system shutdown for cleaning
– Notification: Management escalation
Integration with Overall System Management
Multi-Parameter Monitoring Platform
Biofilm control integrates with broader water quality management:
| Parameter | Impact on Biofilm | Monitoring Frequency |
|---|---|---|
| Chlorine/bromine residual | Primary biocide control | Continuous |
| ORP | Oxidizing biocide effectiveness | Continuous |
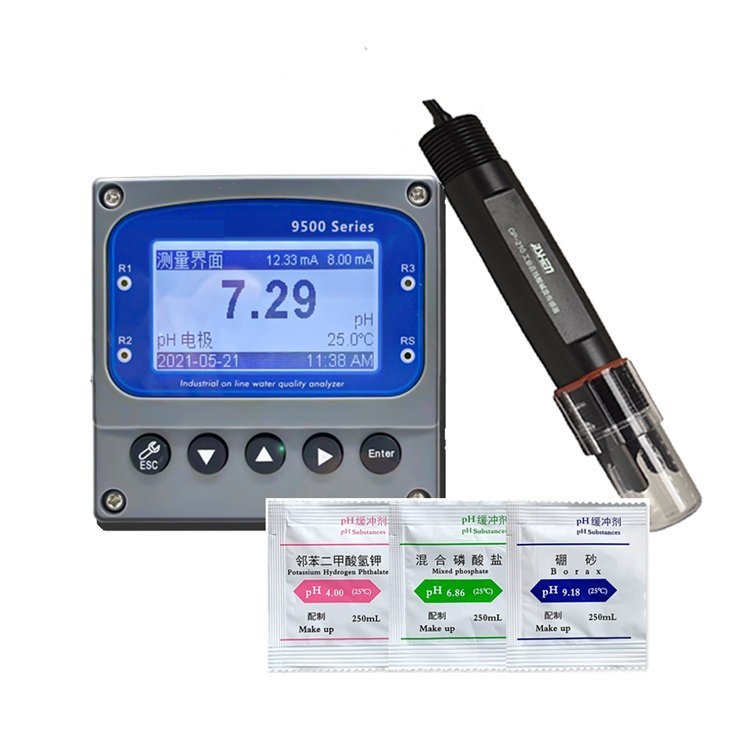
| pH | Biocide stability, bacterial growth rate | Continuous |
| Temperature | Growth rate, biocide demand | Continuous |
| Conductivity | Concentration cycles | Continuous |
| Dissolved oxygen | Aerobic/anaerobic conditions | Periodic |
Shanghai ChiMay’s multi-parameter transmitters process signals from all monitoring points simultaneously, calculating biofilm risk indices and automatically adjusting biocide feed systems based on integrated water quality data.
Predictive Modeling
Advanced systems incorporate predictive algorithms that forecast biofilm development:
Input Variables:
– Current microbial load (ATP, turbidity)
– Historical trends (7-30 day analysis)
– Water temperature profile
– Biocide residual history
– System retention time
Output:
– Probability of biofilm problems within 48-72 hours
– Recommended treatment adjustments
– Optimal timing for preventive dosing
Economic Benefits Analysis
Case Example: Petrochemical Facility
As an illustrative example—representative figures, not audited data—a petrochemical complex implemented sensor-based biofilm control on three cooling towers:
Initial Conditions:
– Annual biocide cost: $185,000
– Heat exchanger cleaning: $95,000/year (2 cycles)
– Corrosion-related maintenance: $220,000/year
– Total biological-related costs: $500,000/year
Implementation:
– ATP monitoring systems: $45,000
– Turbidity monitoring: $12,000
– Control system integration: $28,000
– Total capital investment: $85,000
Results After Two Years:
– Biocide consumption reduction: 30% ($55,500/year savings)
– Heat exchanger cleaning: Eliminated ($95,000/year savings)
– Corrosion maintenance reduction: 35% ($77,000/year savings)
– Annual operating savings: $227,500
– Payback period: < 6 months
ROI Summary
| Metric | Traditional Program | Sensor-Based Program | Improvement |
|---|---|---|---|
| Biocide cost | $185,000/year | $129,500/year | 30% reduction |
| Cleaning frequency | 2 cycles/year | 0 cycles/year | 100% reduction |
| Corrosion failures | 3-4 events/year | 1-2 events/year | 60% reduction |
| Treatment labor | 12 hours/week | 4 hours/week | 67% reduction |
Implementation Recommendations
Phase 1: Baseline Assessment (Months 1-2)
- Install ATP and turbidity monitoring
- Establish baseline biofilm conditions
- Characterize system-specific thresholds
- Document existing treatment program performance
Phase 2: Control Optimization (Months 3-4)
- Configure automated response algorithms
- Optimize biocide dosing based on sensor feedback
- Validate threshold settings against system response
- Train operations personnel
Phase 3: Full Integration (Months 5-6)
- Integrate with existing DCS/SCADA systems
- Implement predictive alerting
- Establish continuous improvement protocols
- Document standard operating procedures
Conclusion
Sensor-based biofilm control is a real step forward in cooling water management. By providing continuous visibility into microbial conditions, these systems enable treatment interventions before biofilm problems cause significant damage or efficiency losses.
Shanghai ChiMay’s biofilm monitoring solutions combine multiple sensing technologies with control algorithms that let facilities move from calendar-based treatment schedules to condition-based strategies. The resulting improvements in treatment effectiveness and cost efficiency typically deliver payback periods of 6-12 months.