Table of Contents
Introduction
Cooling towers represent the thermal management backbone of power generation facilities, removing waste heat from condenser water and enabling efficient steam cycle operation. A single 500 MW power plant may operate multiple cooling towers handling over 150,000 gallons per minute of recirculating water. Within these systems, conductivity control determines whether facilities operate efficiently with minimal resource consumption or suffer preventable equipment degradation and excessive operating costs. This guide provides comprehensive coverage of cooling tower conductivity control—from fundamental principles through advanced optimization strategies—that enables facilities to maximize efficiency while protecting critical equipment.
Understanding Cooling Tower Water Chemistry
The Concentration Cycle Phenomenon
As cooling towers operate, water evaporates, concentrating dissolved minerals in the recirculating water:
| Water Source | Typical Conductivity | Dissolved Solids |
|---|---|---|
| City water | 150-400 μS/cm | 75-200 ppm |
| Well water | 300-1,500 μS/cm | 150-750 ppm |
| Treated effluent | 500-2,000 μS/cm | 250-1,000 ppm |
Each cycle of concentration multiplies the mineral content of the makeup water:
- 3 cycles: 3× original concentration
- 5 cycles: 5× original concentration
- 7 cycles: 7× original concentration
Conductivity Thresholds and Consequences
| Conductivity Range | System Status | Consequences |
|---|---|---|
| < 1,000 μS/cm | Excellent | Minimal scaling risk |
| 1,000-2,000 μS/cm | Acceptable | Normal operation |
| 2,000-3,000 μS/cm | Caution | Increased scaling potential |
| > 3,000 μS/cm | High Risk | Significant scale/corrosion risk |
| > 5,000 μS/cm | Critical | Equipment damage imminent |
Conductivity Measurement Technology
Sensor Selection Criteria
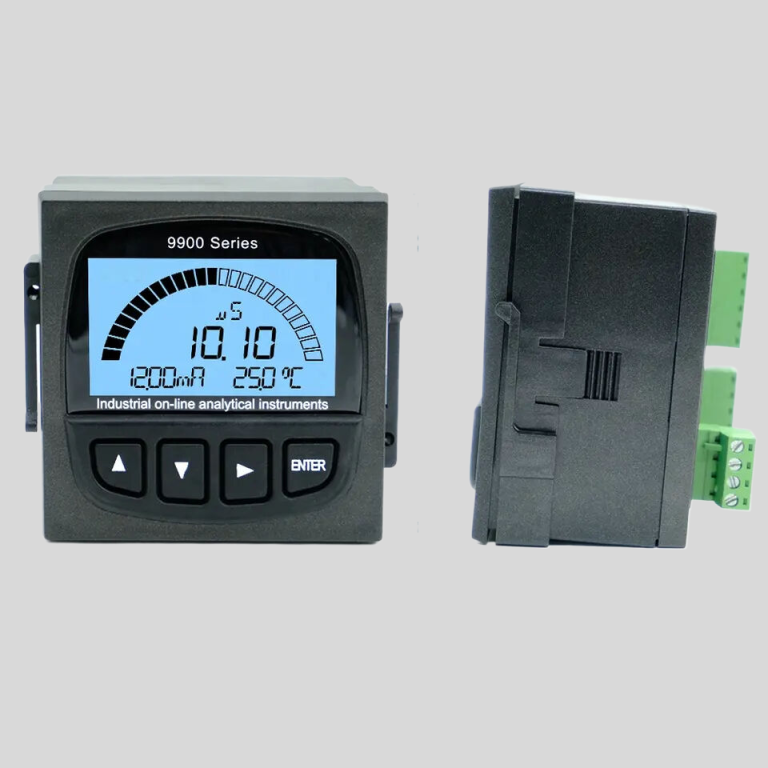
Shanghai ChiMay offers conductivity sensors designed specifically for cooling tower applications:
| Feature | Specification | Benefit |
|---|---|---|
| Electrode material | Graphite or stainless steel | Corrosion resistance |
| Cell constant | K=0.1 to K=10 | Match measurement range |
| Temperature compensation | Automatic, 0-60°C | Accurate readings |
| Response time | < 10 seconds | Rapid process response |
| Maximum pressure | 100 PSI | Cooling system compatibility |
| Wetted materials | FDA-approved polymers | Chemical compatibility |
Installation Best Practices
Proper sensor installation determines measurement accuracy and reliability:
- Location selection: Install in well-mixed flow region, avoid dead zones
- Orientation: Horizontal or upward flow prevents air entrapment
- Flow rate: Maintain minimum velocity of 1-3 ft/sec for self-cleaning
- Temperature consideration: Locate downstream of heat exchangers for stable readings
- Accessibility: Position for easy calibration and maintenance access
Automated Control Strategies
Basic Conductivity Control Loop
The fundamental conductivity control system operates as follows:
Setpoint: 2,500 μS/cm (adjustable)
Measured Conductivity: Real-time reading
Error Signal: Setpoint - Measured
Blowdown Valve: PID controller output
Result: Blowdown rate proportional to concentration
Advanced Control Algorithms
Modern control systems incorporate additional factors:
- Feedforward Control: Adjusts blowdown based on makeup water conductivity changes
- Weather Compensation: Modifies setpoint based on ambient temperature and humidity
- Chemical Dosing Integration: Coordinates blowdown with treatment additions
- Multi-Parameter Optimization: Considers pH, corrosion rate, and microbial count together
Setpoint Optimization
Optimal conductivity setpoint balances water conservation against equipment protection:
| Facility Type | Recommended Setpoint | Control Approach |
|---|---|---|
| Standard power plant | 2,000-2,500 μS/cm | Push cycles as high as water chemistry allows |
| Sensitive equipment | 1,500-2,000 μS/cm | Favor deposit protection over water savings |
| Harsh environment | 2,500-3,000 μS/cm | Supported by a robust inhibitor program |
Automated conductivity control typically trims makeup water use by double-digit percentages versus timer- or manual-based blowdown, with the largest gains in facilities running conservatively low cycles today.
Water Conservation Strategies
Cycles of Concentration Optimization
Increasing cycles of concentration reduces water consumption:
| Cycles | Makeup Water Reduction (approximate) | Scaling Risk |
|---|---|---|
| 2-3 | Baseline | Very low |
| 4-5 | 20-30% | Low |
| 6-7 | 30-40% | Moderate |
| 8-10 | 40-50% | High |
Recommended approach: Start at conservative cycles (3-4) and increase gradually while monitoring scale formation indicators.
Side-Stream Filtration
Supplementing conductivity control with side-stream filtration enables higher cycles:
- Remove suspended solids reducing turbidity
- Filter out precipitated minerals before deposition
- Often allow one to two additional cycles compared with non-filtered systems
Filtration systems:
- Sand filters: $15,000-45,000 installed, 80% solids removal
- Automatic backwash filters: $25,000-65,000 installed, 90% solids removal
- Membrane filtration: $85,000-150,000 installed, 95%+ removal
Water Reuse Integration
Advanced facilities integrate conductivity control with water reuse streams:
- RO permeate: Low-conductivity water for makeup
- Clarified effluent: Medium-conductivity requiring treatment
- Stormwater: Variable quality requiring monitoring
Chemical Treatment Coordination
Scaling Inhibitor Programs
Conductivity control works synergistically with chemical scale inhibitors:
| Inhibitor Type | Dosage | Effect |
|---|---|---|
| Phosphonates | 2-5 ppm | Crystal modification |
| Polyacrylates | 3-8 ppm | Threshold inhibition |
| Copolymers | 5-10 ppm | Dispersion + inhibition |
Corrosion Inhibitor Programs
| Inhibitor Type | Application | Conductivity Impact |
|---|---|---|
| Molybdates | 100-300 ppm | Slight increase |
| Nitrites | 500-1,000 ppm | Moderate increase |
| Phosphates | 20-50 ppm | Variable |
Biocide Integration
Microbial control programs must coordinate with conductivity management:
- Biocide demand increases with higher conductivity
- Biofilm removal may temporarily spike conductivity
- Continuous low-level dosing more effective than periodic shock treatment
Maintenance Best Practices
Calibration Protocol
| Frequency | Action | Standard |
|---|---|---|
| Weekly | Visual inspection | — |
| Monthly | Clean sensor | Soft brush, mild acid |
| Quarterly | Verify calibration | NIST-traceable solution |
| Semi-annually | Full calibration | NIST-traceable solution |
| Annually | Replace sensor | As needed |
Common Problems and Solutions
| Symptom | Possible Cause | Solution |
|---|---|---|
| Erratic readings | Air bubbles | Relocate sensor |
| Drift | Contaminated electrode | Clean or replace |
| Constant high reading | Scale buildup | Acid cleaning |
| No response | Failed sensor | Replace electrode |
| Intermittent output | Connection problem | Check wiring |
Economic Analysis
Implementation Costs
| Component | Cost Range |
|---|---|
| Conductivity sensor | $800-2,500 |
| Transmitter/controller | $2,000-6,000 |
| Blowdown valve assembly | $3,000-8,000 |
| Installation labor | $2,000-5,000 |
| Integration/calibration | $1,500-3,500 |
| Total System | $9,300-25,000 |
Annual Savings
Savings come from four directions—water purchases avoided through higher cycles, chemicals not over-injected, wastewater discharge fees avoided, and maintenance deferred when scale is controlled. The combined total commonly reaches five to six figures per year for a mid-size power plant system, with water and chemicals typically the largest components.
Return on Investment
With total implementation costs of $9,300-25,000, most well-optimized systems pay for themselves within a fraction of the first operating year; the exact payback depends on local water and sewer rates and the baseline treatment program.
Conclusion
Cooling tower conductivity control represents a fundamental element of efficient power plant water management. By combining continuous conductivity monitoring with automated blowdown control, facilities can simultaneously reduce water consumption, optimize chemical treatment, and protect equipment from scale and corrosion damage. Shanghai ChiMay provides conductivity measurement solutions—including inline sensors, transmitters, and control systems—designed specifically for cooling tower applications.
Facilities implementing comprehensive conductivity control consistently achieve double-digit reductions in both water consumption and chemical treatment costs while extending equipment service life. With payback typically measured in months rather than years, conductivity control investment delivers strong return while supporting environmental sustainability objectives.