Table of Contents
Short answer
- Aeration is usually the single largest electricity load at a treatment plant, so DO control is where the energy savings live.
- Blowers run against a moving target. Load varies by hour, temperature, and inflow strength, and a fixed setpoint is wrong most of the time.
- Nitrifiers are the sensitive part of the biomass. Let DO sag and ammonia slips through, even if BOD removal looks fine.
- Electrochemical and optical DO sensors both work. The practical difference is maintenance interval, not principle.
Biological treatment depends on microorganisms that need oxygen to metabolize organic pollutants. Many plants still run aeration on fixed setpoints and periodic DO checks, guiding a process that changes continuously with a schedule that does not. The cost shows up twice: blowers running flat out when load is low, and ammonia breaking through when load spikes.
What makes DO control so decisive? It sits directly on the relationship between oxygen supply, microbial kinetics, and blower power.
The Biology of Aerobic Treatment
Microbial Oxygen Requirements
Activated sludge systems rely on aerobic bacteria that oxidize organic matter to carbon dioxide and water. Design texts such as Metcalf & Eddy’s Wastewater Engineering use roughly 1.0 mg O₂ per mg BOD removed as a working figure for carbonaceous oxidation, with the exact value depending on sludge age and whether endogenous respiration is included. DO concentration governs how fast that oxidation proceeds:
- DO < 0.5 mg/L: respiration severely limited, risk of anaerobic conditions and filamentous bulking
- DO 0.5-1.5 mg/L: oxygen-limited, reduced treatment efficiency
- DO 1.5-3.0 mg/L: normal operating band for most activated sludge processes
- DO > 3.0 mg/L: excess aeration, wasted energy
Because oxygen demand moves with wastewater strength, flow, temperature, and biomass activity, DO has to be measured continuously rather than assumed.
Nitrification Sensitivity
Where ammonia removal is required, DO control becomes tighter. Nitrifying bacteria (Nitrosomonas and Nitrobacter) are obligate aerobes with far lower maximum growth rates than the heterotrophs that remove BOD, so they lose the competition for oxygen first. The practical consequences are well established in the treatment literature:
- Nitrification rate falls off as DO drops below about 2 mg/L, and the penalty steepens sharply below 1.5 mg/L
- Nitrification effectively stalls once DO sits below roughly 0.5 mg/L for an extended period
- Recovery after a low-DO event takes days, sometimes weeks, because nitrifier biomass has to regrow
- Maximum growth rates for nitrifiers are about an order of magnitude lower than for heterotrophs
These sensitivities are why plants with ammonia limits cannot tolerate the blind spots built into once-a-day DO checks.
Energy Consumption Implications
Aeration System Operating Costs
Aeration blowers typically account for the largest share of a treatment plant’s electricity bill, commonly in the range of half the total site consumption. For a plant treating 5 million gallons per day, the blower bill runs into the hundreds of thousands of dollars a year at industrial electricity rates. Published plant retrofits that move from fixed aeration to DO-based control commonly report aeration energy reductions in the range of 20 to 35%, with the largest gains where the previous operation had no dissolved oxygen feedback at all.
Demand-Variable Operation
Traditional aeration control uses fixed blower output or simple timers. Neither follows actual oxygen demand, which produces:
- Over-aeration during low-load periods (typically nights and weekends)
- Under-aeration during peak loading events
- Process variability from feast-famine cycling
Advanced DO-based control systems adjust aeration to measured demand. The general ordering of results, from published plant experience, is:
| Control strategy | Aeration energy | Comment |
|---|---|---|
| Fixed blower output | Baseline | Blowers sized for peak, run continuously |
| Timer-based modulation | Slightly below baseline | Scheduled rather than measured |
| DO-based PID control | Substantially lower | Feedback on measured DO |
| DO plus ammonia control | Lowest | Aeration follows nitrogen load as well as DO |
Results are plant-specific. Turndown capability, diffuser condition, blower type, and sensor location all shift the outcome, and a plant with oversized blowers will capture more savings than one already running near optimum.
Control System Architectures
Simple DO-Based Control
The common approach uses a single DO sensor to trim blower output through PID control:
- Sensor location: must be representative, typically in the last third of the aeration basin
- Setpoint: fixed or adjusted from ammonia load estimates
- Blower modulation: variable frequency drives for continuous output adjustment
- Typical response: oscillation around setpoint measured in minutes
Multi-Point DO Control
Larger plants benefit from distributed DO monitoring across zones:
- Zone-specific aeration: individual control of aeration grid sections
- Spatial DO mapping: identifying low-DO zones that need more air
- Plug flow optimization: stepped-down setpoints along the reactor length
- Load distribution: moving air between zones based on measured oxygen uptake
General guidance from ASCE and WEF treatment practice points to multi-point monitoring once plants reach the low single-digit MGD range, where a single point stops representing the basin.
Integrated Nutrient Control
Advanced systems combine DO with ammonia and nitrate measurement for complete nutrient control:
- Ammonia-based aeration: increasing air when ammonia climbs above setpoint
- Denitrification timing: sequential aerated and unaerated zones
- Process optimization: model-based setpoint adjustment across all parameters
Sensor Technology Comparison
Electrochemical (Polarographic/Galvanic) Sensors
Traditional DO sensors use an electrochemical membrane cell:
- Principle: oxygen diffuses through a membrane to the electrode, generating current proportional to concentration
- Advantages: lower purchase cost, well understood
- Limitations: membrane fouling, electrolyte depletion, some flow sensitivity
- Service interval: membrane and electrolyte replacement every few months
Optical (Luminescent) Sensors
Optical DO sensors use a luminescent dye quenched by oxygen:
- Principle: light excites the dye, oxygen quenches the luminescence in proportion to concentration
- Advantages: no membrane or electrolyte, little maintenance, largely flow-independent
- Limitations: higher purchase cost, periodic cap replacement
- Service interval: sensor cap replaced roughly every one to three years
Optical sensors have largely replaced membrane sensors in new municipal installations, mostly because the maintenance interval is measured in years instead of months and there is no electrolyte to run dry. WEF practice guidance reflects that shift.
Implementation Best Practices
Sensor Installation Guidelines
- Depth: submerged well below the surface, clear of the wave zone and of diffuser air plumes
- Orientation: sensing face exposed to flow, protected from debris
- Cleaning: automatic wipers or air cleaning for fouling-prone service
- Calibration: in-situ calibration against a reference method, or air calibration where appropriate
Maintenance Protocols
| Maintenance task | Electrochemical | Optical |
|---|---|---|
| Electrolyte replacement | 3-6 months | N/A |
| Membrane replacement | 3-6 months | N/A |
| Sensor cap replacement | N/A | 12-36 months |
| Calibration verification | Monthly | Quarterly |
Control System Tuning
PID tuning determines whether the savings materialize:
- Proportional gain: adjusts responsiveness to DO error
- Integral time: removes steady-state error
- Derivative action: damps oscillation
- Setpoint strategy: fixed, load-following, or ammonia-trimmed
A poorly tuned loop chasing a noisy sensor burns more energy than a fixed setpoint. Sensor response time, sample transport lag, and blower turndown all set limits on how tight the control band can be.
Case Study: Municipal Treatment Plant Optimization
A municipal plant in the 10-20 MGD range retrofitted aeration control with online DO monitoring, VFD-driven blowers, and ammonia trimming. Before the retrofit, DO swung across a wide band from below 1 mg/L to nearly 5 mg/L, blowers ran flat out, and nitrification efficiency was inconsistent enough to threaten permit compliance.
After commissioning, DO held inside a band of roughly 1.8 to 2.5 mg/L, aeration energy dropped by about a third, blower runtime fell from continuous operation to around 18 hours a day on average, and nitrification became stable and predictable. Instrumentation and control payback came in at around two years, which is typical for this kind of retrofit where the blowers already have variable speed drives.
Where This Goes Next
DO monitoring and control keep improving:
- Model-based control: setpoints derived from load and kinetics rather than fixed rules
- Multi-parameter sondes: DO, ammonia, nitrate, and turbidity from one instrument
- Wireless sensor networks: removing wiring for distributed monitoring
- Digital twin simulation: testing control strategies before deploying them
The direction of travel is clear: as energy prices and nitrogen limits both tighten, measurement-based aeration control moves from optional optimization to standard design.
What This Means in Practice
Dissolved oxygen control sits at the intersection of energy cost and treatment reliability. Aeration dominates a plant’s electricity bill, DO optimization is one of the highest-return measures available, and continuous DO monitoring is what makes that optimization possible. Plants moving from fixed control to DO-based control commonly report aeration energy reductions of 20 to 35%, with payback measured in a couple of years.
The second benefit is quieter but just as important: steady DO keeps nitrifiers alive and ammonia in compliance, which is what protects the permit. As energy costs rise and ammonia limits tighten, DO monitoring stops being an efficiency project and becomes basic infrastructure.
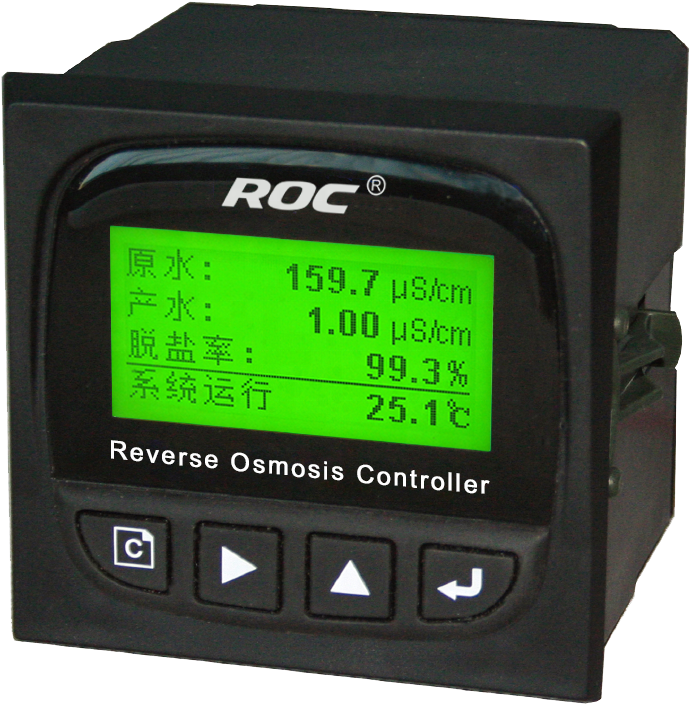
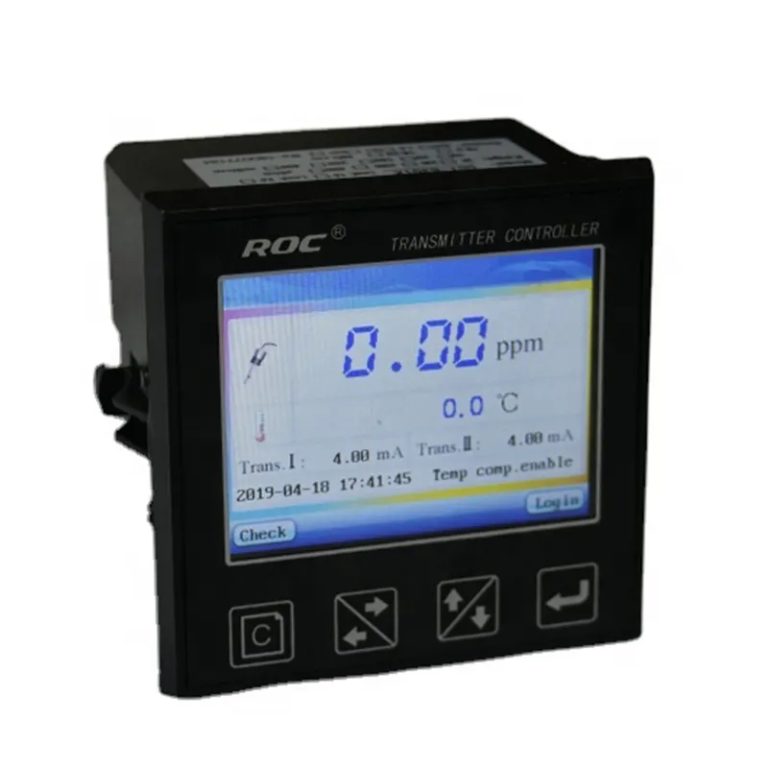
Shanghai ChiMay’s dissolved oxygen sensor portfolio includes both electrochemical and optical technologies to match different application and maintenance requirements. Combined with transmitters offering digital communication and control loop outputs, these sensors provide the measurement layer for efficient biological treatment operation.